

Is the Gold and Silver Retracement Over? Let's See What Our New & Improved Breadth Analysis Indicator Has to Say!
Add this new tradingview indicator to your charts to get an edge on the next buying and selling locations in this precious metals bull market.

“3 things move markets, Money, Momentum and Sentiment”.
Money: In short, capital flows. It takes a bid to raise the price. We measure this with volumetric indicators. After all, low volume, low money. Price movement is just an imbalance of buyers and sellers. Money is different than people. A single market participant can supply all of the buying power.
Sentiment: Often referred to as fear and greed index. This is typically measured with the implied volatility premium of puts. Put another way, the insurance premium needed to protect an institutional position from permanent loss. Average true range (ATR) and Bollinger bands would illustrate as well.
Momentum: The behavior of crowds. “Like moths to light”, investors are almost always influenced by the movement of prices in either direction. While higher prices should immediately cause a person to desire less, in markets it often works in reverse. Fear of missing out and following the crowds are powerful emotions. We measure momentum with “econometrics” (fancy math word for moving averages). Including RSI, MACD, MTM, ROC and the example here DMA (distance from moving average).
For a complete overview of how to apply these to TA and your own chart setups be sure and read:

Wouldn’t it be nice to trim and re-enter volatility in bull markets? Well, we upgraded our DMA indicator to help you do just that!
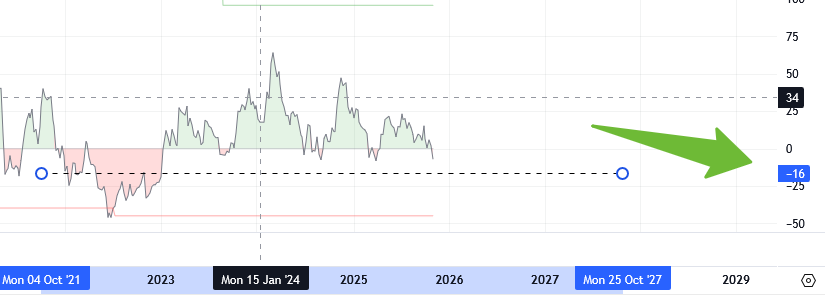
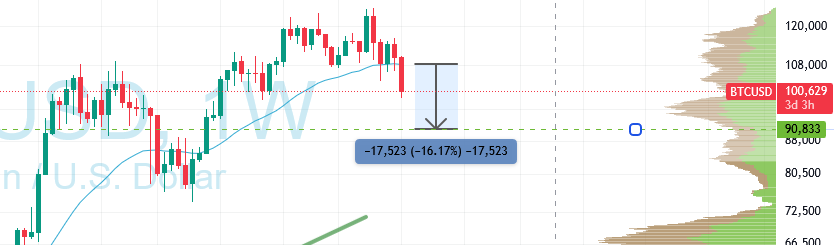
Note: simple price action patterns often appear first on the momentum indicators as a sign of reversal and support and resistance. Think of it as an early preview! To plot support resistance targets on the price chart, simply apply the percentage on the right in the DMA pane…

To the percentage up or down relative to (200) MA on the price chart. This next DMA support zone for BTC targets around 91k.

On to today’s charts… let’s see it in action:
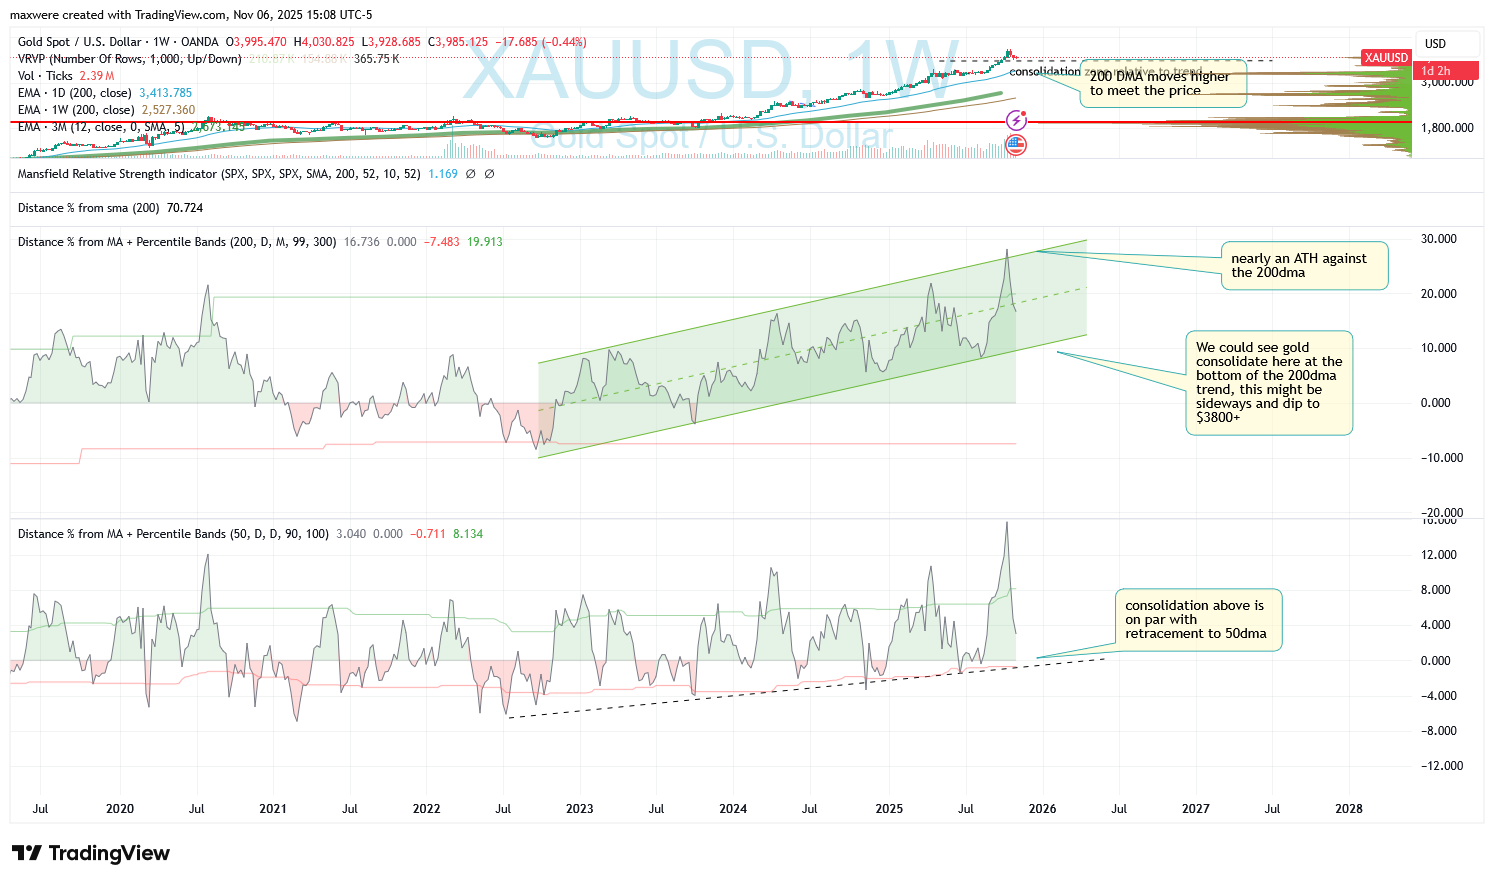
Gold
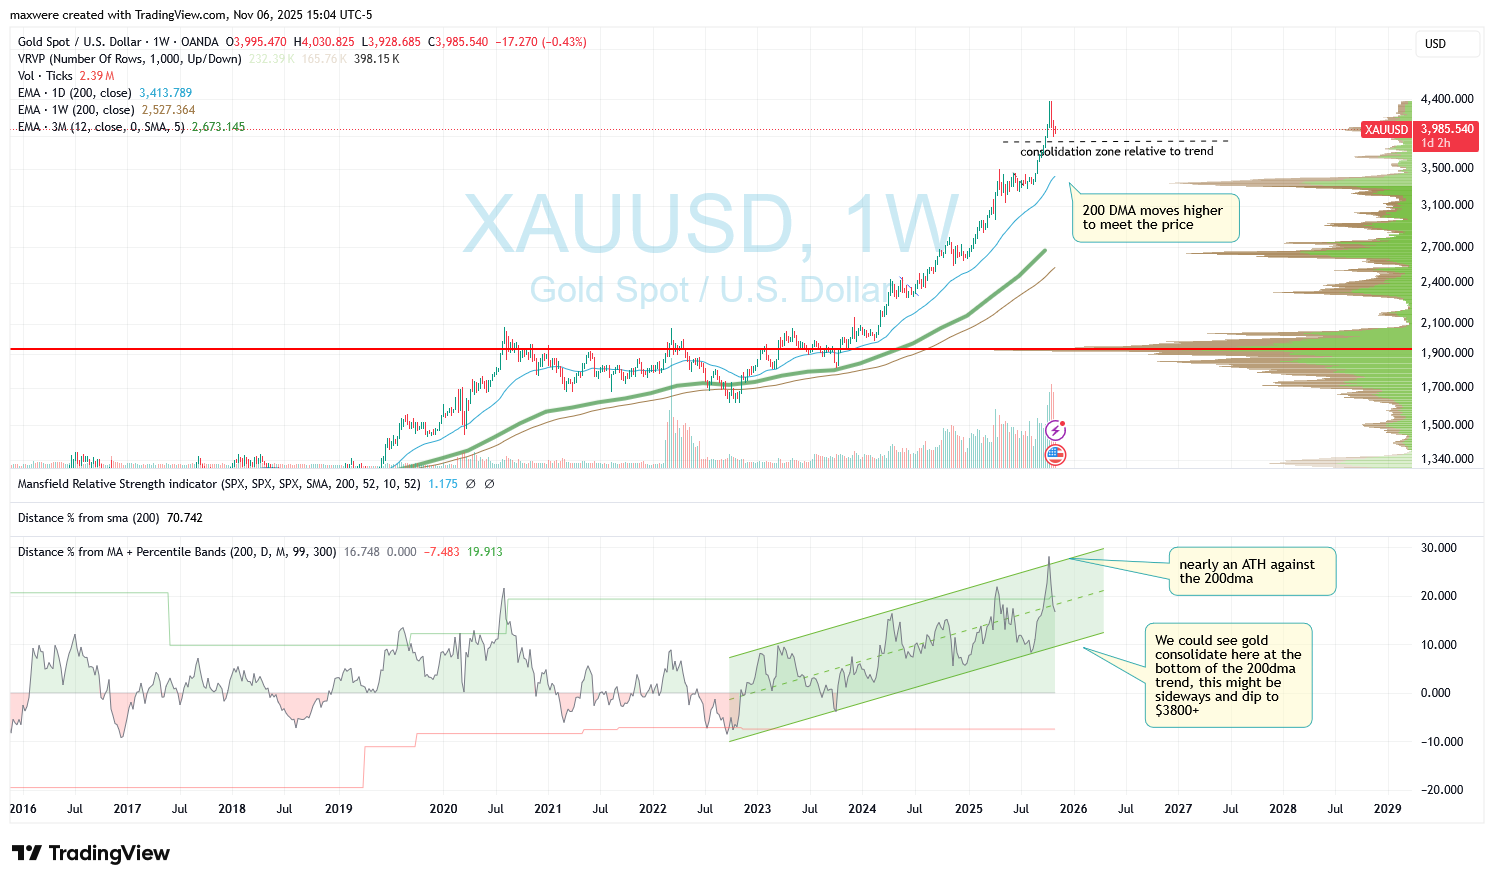
While there are forecasts for a deeper retracement to $3500, price momentum in DMA suggests support could be higher. The ATH against the 200dma were due to give way, but there is an argument retracement may not be deep. Take a look at how the trend below takes us to par with the 50dma.
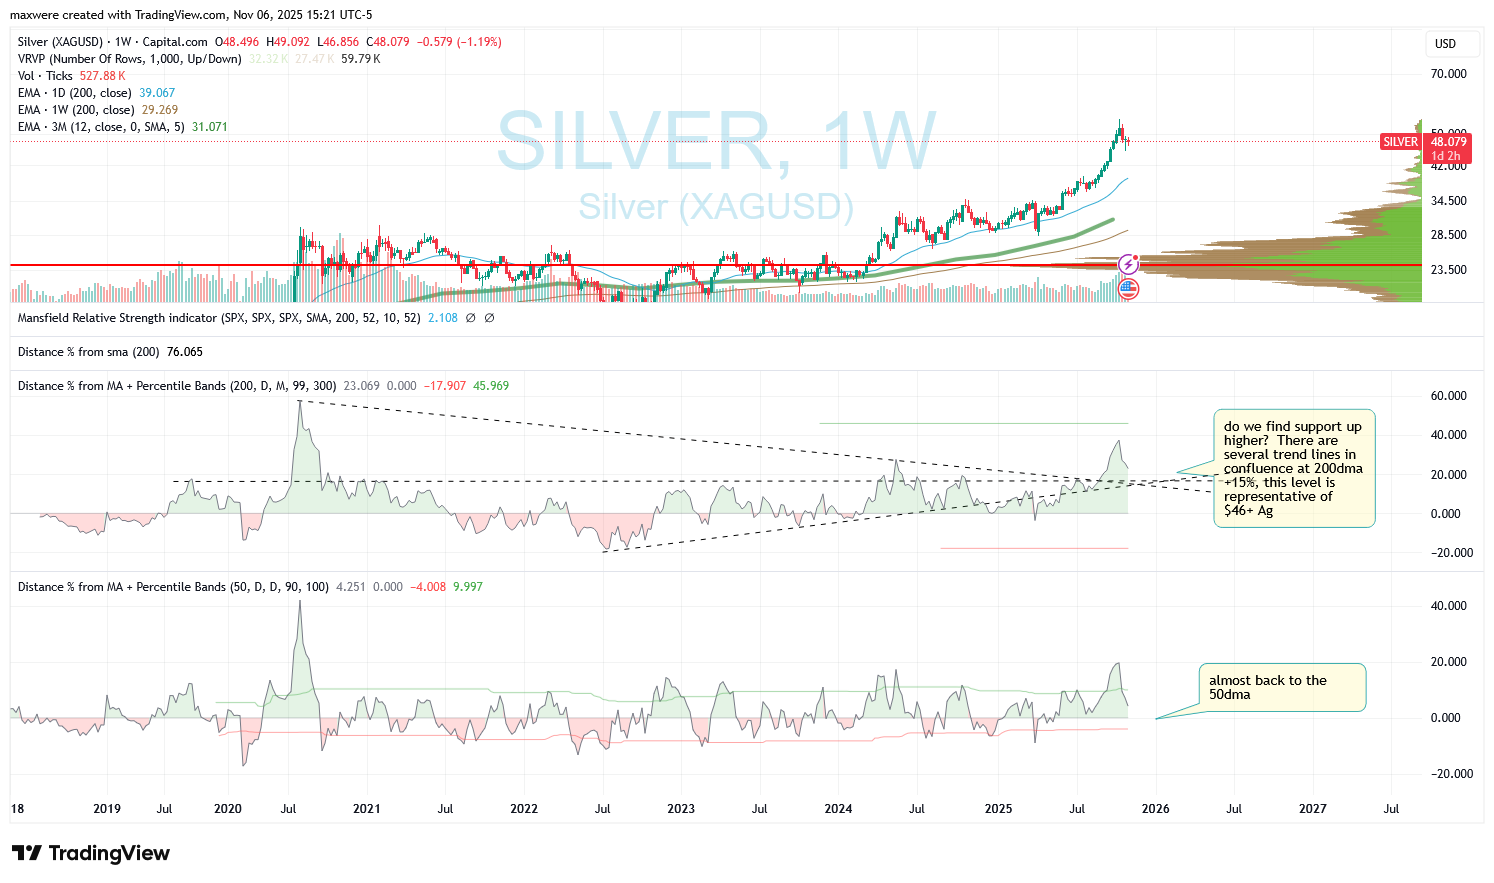
Silver
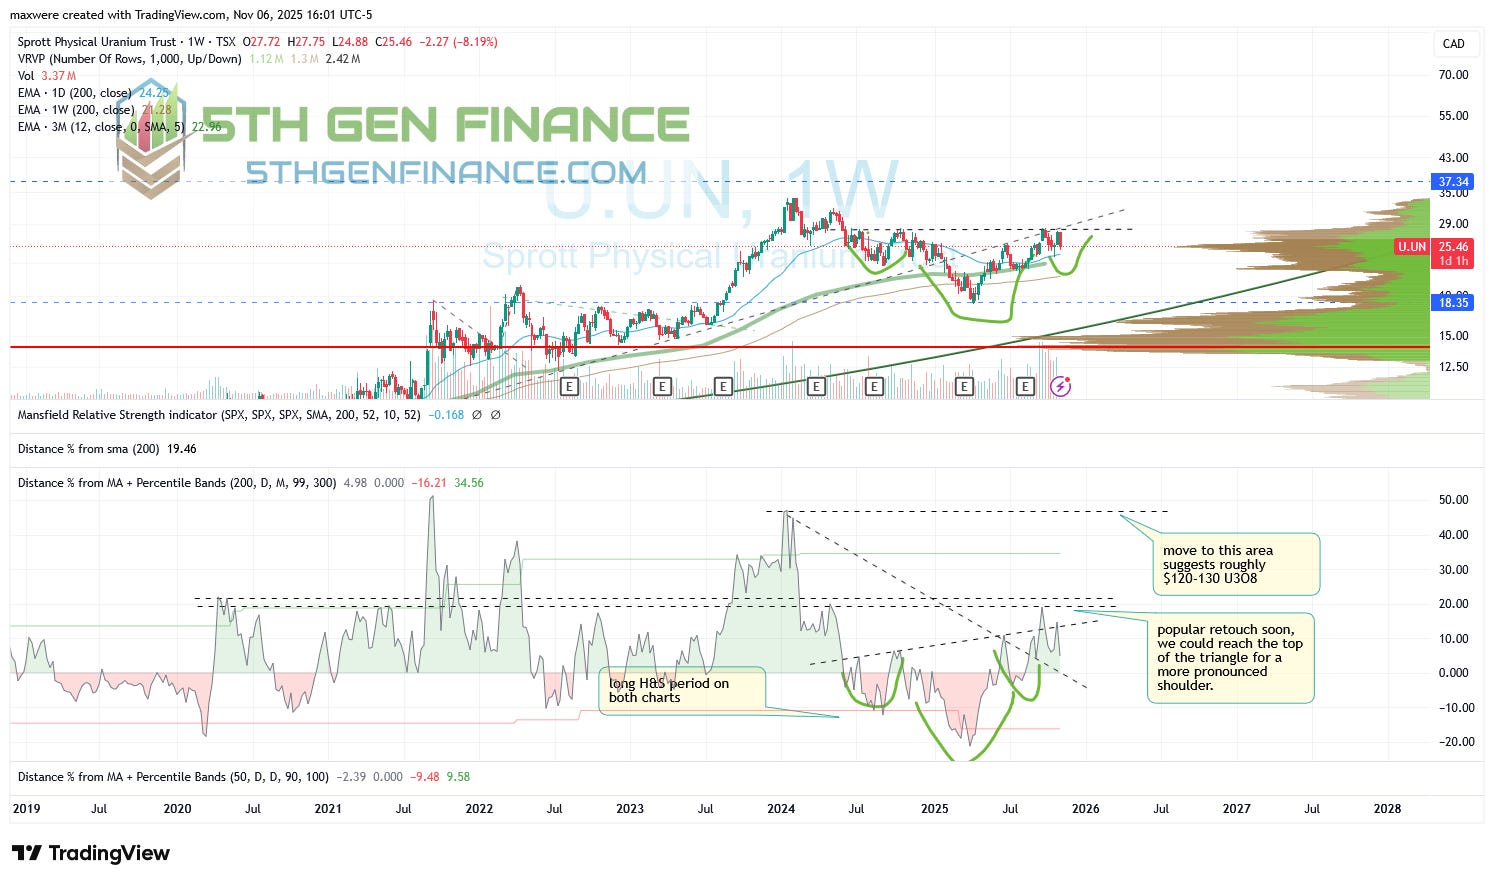
Uranium
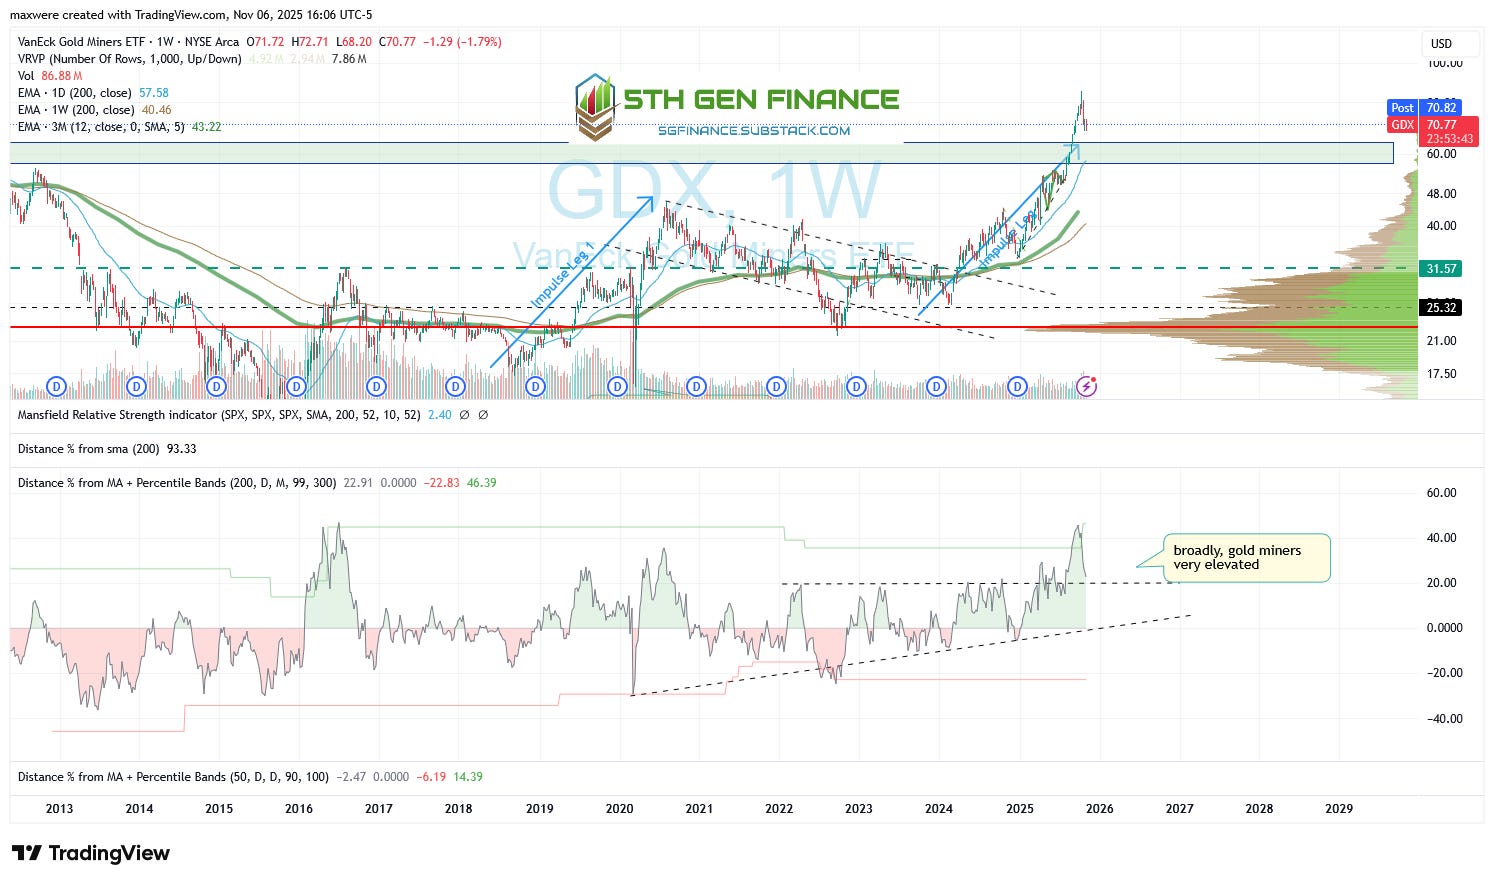
Gold Miners (Majors)
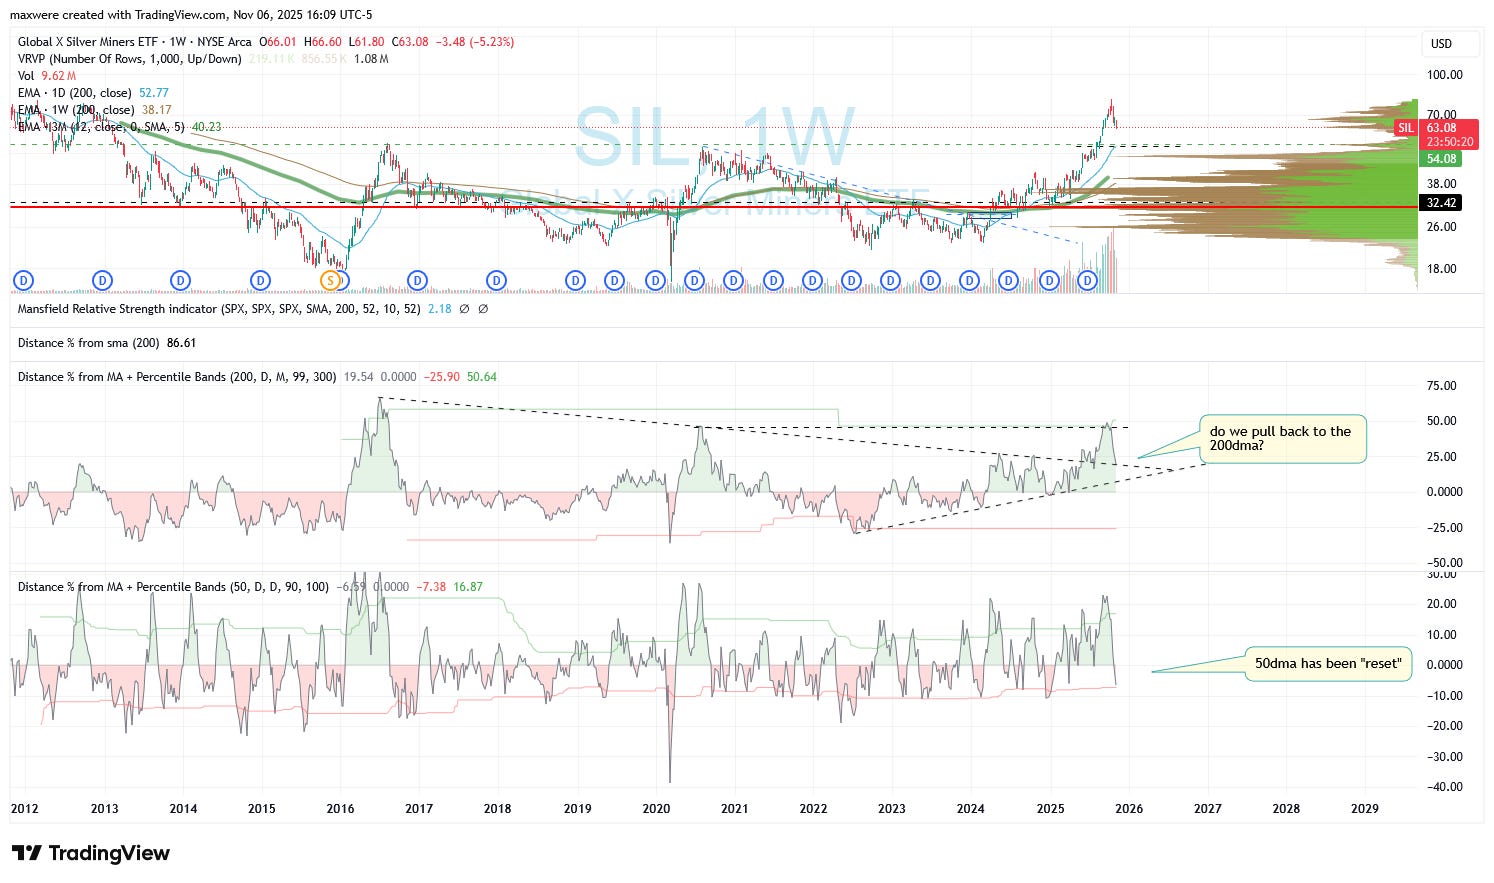
Silver Miners (Majors)
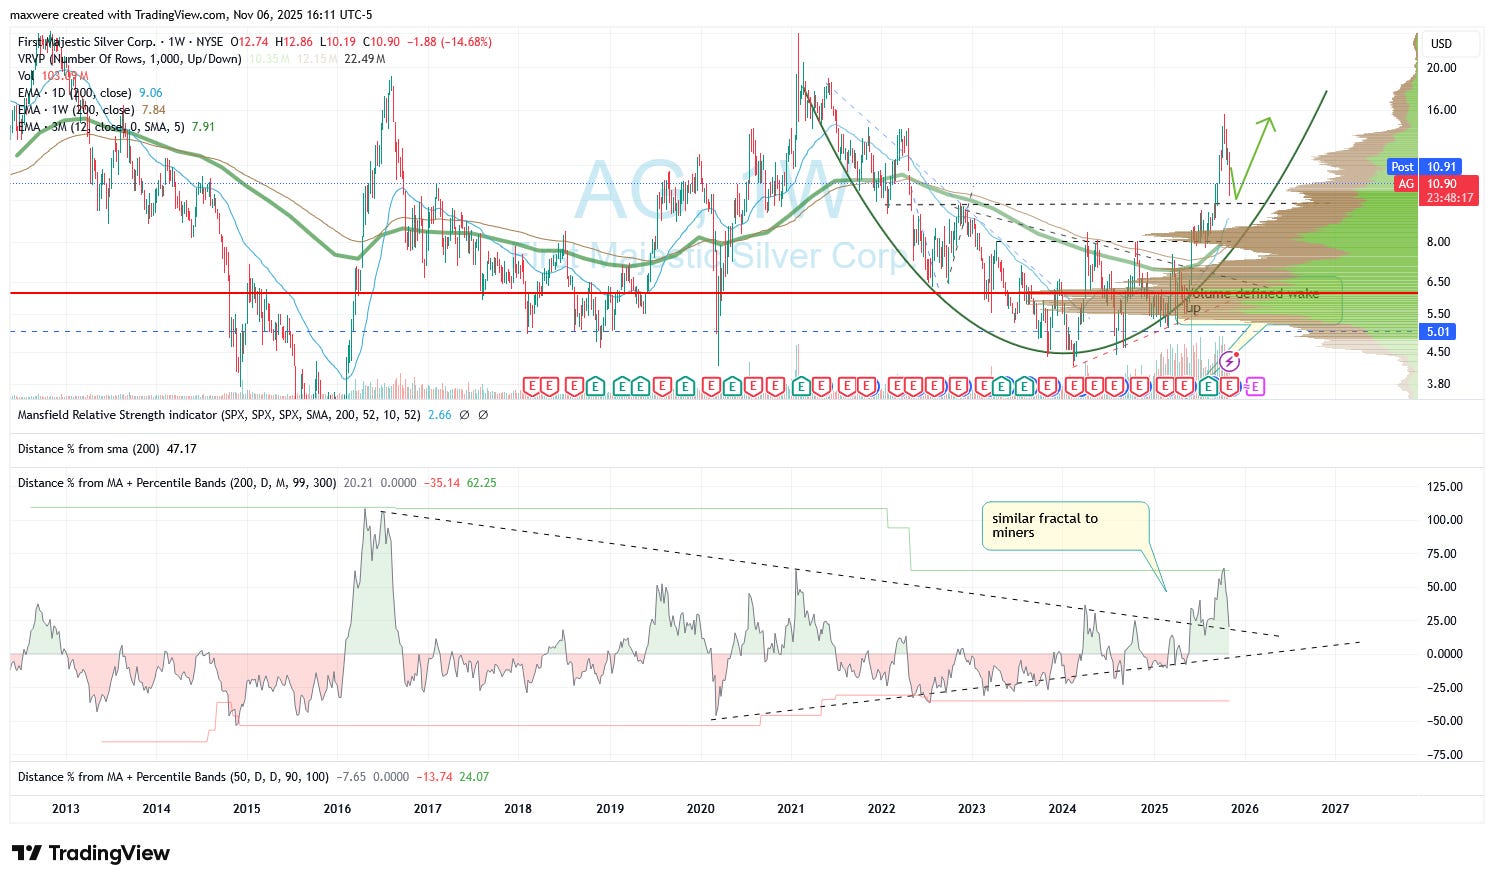
AG - First Majestic
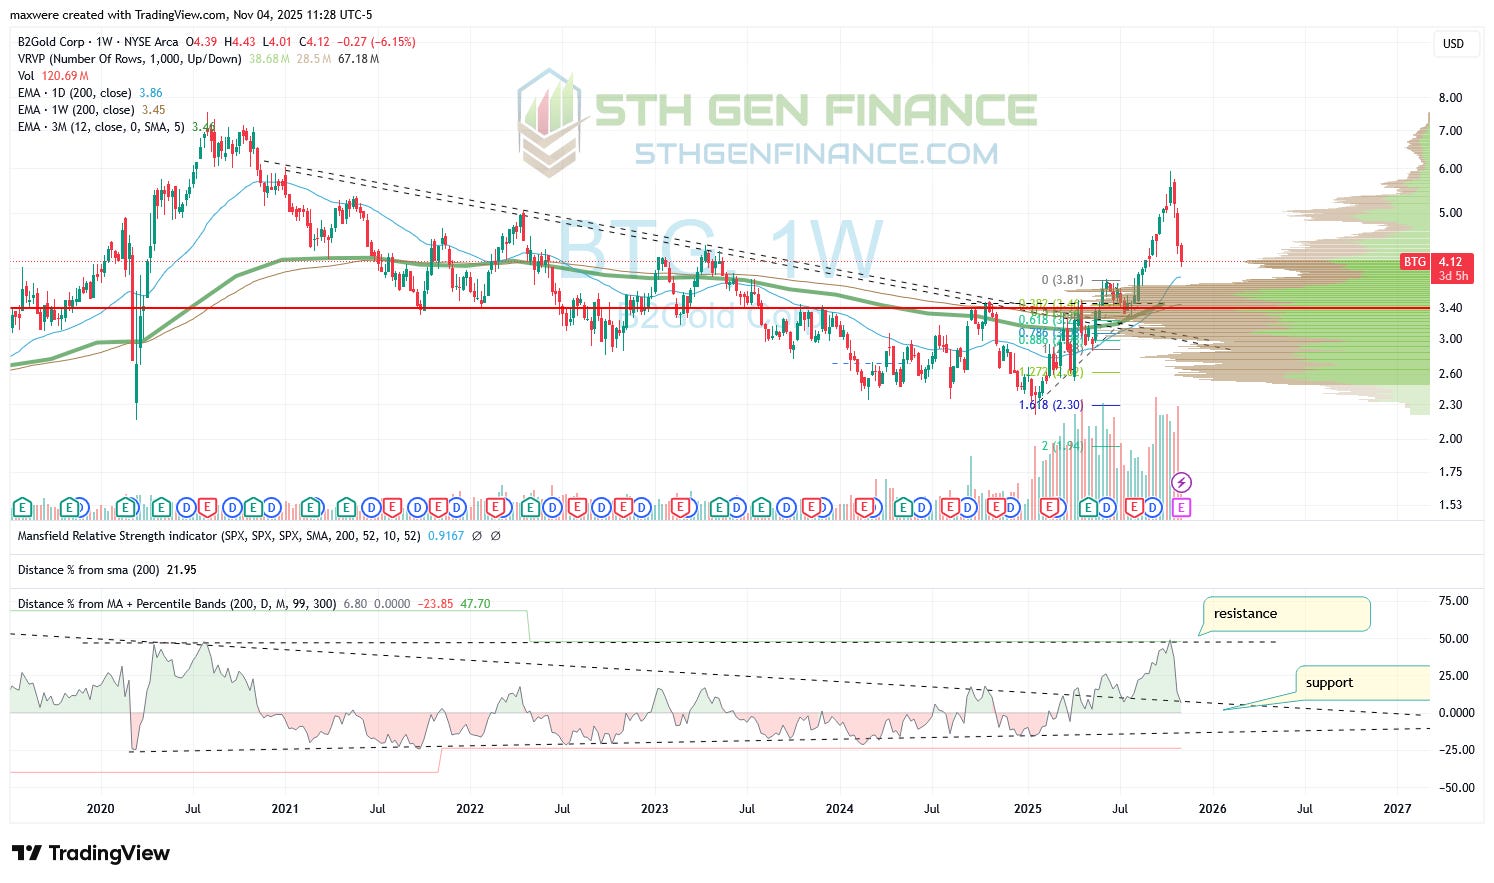
BTG - B2 Gold
STOP: Don’t have a Tradingview account yet?
Install the Indicator for Yourself
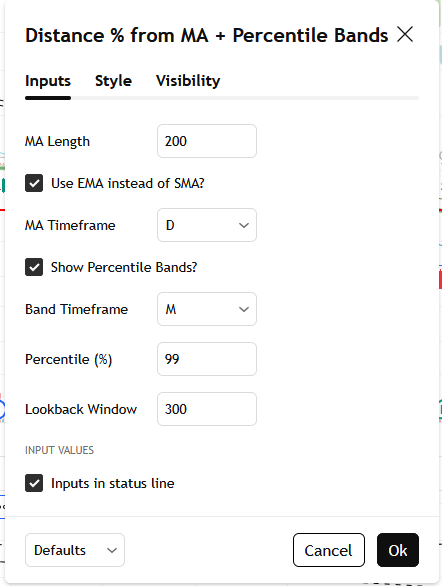
MA Length - set the moving average to number of bars defined by MA Timeframe
MA Timeframe - use chart, or specific timeframe for a specific MA. Here we use 200DMA as it is a highly adopted indicator by virtually all traders and timeframes.
Use EMA? - check to use exponential moving average vs simple moving average. If you intend to use the indicator to plot profit taking targets, it should align with the moving average type you use on your charts. SMA and EMA of the same time period will often be in different places.
Show Percentile Bands - This is very similar to Bollinger band concept. It looks back and identifies recent peaks depending on how far back you go. This gives the user a visual clue to how stretched the price is in either direction.
…or copy the following script to your pinescript editor:
//@version=5
indicator(”Distance % from MA + Percentile Bands”, overlay=false, dynamic_requests=true)

// Inputs
smaLen = input.int(30, “MA Length”)
useEma = input.bool(false, “Use EMA instead of SMA?”)
ma_tf = input.string(”chart”, “MA Timeframe”, options=[”chart”, “D”, “W”, “M”])
showBands = input.bool(true, “Show Percentile Bands?”)
band_tf = input.string(”D”, “Band Timeframe”, options=[”D”, “W”, “M”])
percentile_p = input.int(90, “Percentile (%)”, minval=1, maxval=99)
percentile_len = input.int(100, “Lookback Window”, minval=10, maxval=1000)

// Calculate moving average
ma_func(src, len) => useEma ? ta.ema(src, len) : ta.sma(src, len)

// Get MA value with timeframe logic
get_ma(tf, len) =>
    if tf == “chart”
        ma_func(close, len)
    else
        request.security(syminfo.tickerid, tf, ma_func(close, len))

ma_val = get_ma(ma_tf, smaLen)

// Calculate distance from mean
distFromMean = (close - ma_val) / ma_val * 100

// Calculate percentile bands
dist_band_tf = request.security(syminfo.tickerid, band_tf, distFromMean)
support = ta.percentile_nearest_rank(dist_band_tf, percentile_len, 100 - percentile_p)
resistance = ta.percentile_nearest_rank(dist_band_tf, percentile_len, percentile_p)

// Plot main line and zero
dist_plot = plot(distFromMean, “Distance % from MA”, color.gray)
zero_line = plot(0, “Zero Line”, color.new(color.gray, 70))

// Plot percentile bands conditionally
plot(showBands ? support : na, “Support”, color.new(color.red, 50))
plot(showBands ? resistance : na, “Resistance”, color.new(color.green, 50))

// Fill background
fill(dist_plot, zero_line, distFromMean >= 0 ? color.new(color.green, 85) : color.new(color.red, 80))