

Is Silver Sentiment Telling Us the Precious Metals Correction Phase Is Nearly Over?
What is sentiment and how do we "see" it for silver & precious metals?

According to Howard Marks, 3 things move markets:
Money
Momentum
Sentiment
Today we focus on sentiment, but for wider view, we cover how to build a fantastic chart setup to capture a wide view of these in this article:

What is sentiment?
To be perfectly honest, sentiment is a purely subjective concept in markets. Fear, greed… those are the emotions described, but for smart money the better terms would be concern and opportunity in forward expectations.
One way we can measure this is the way institutions are buying and selling their short-term hedges.
The VIX
As a subscriber of this substack, you have no doubt heard of the S&P VIX (fear and greed index). Ever wonder what exactly is the ^VIX? Technically it is the implied 30 day forward implied volatility for SPX Index Options. What is implied volatility? In the most practical terms… a measure of the market demand premium for puts and calls.
An increase in VIX means an increase in downside protection because of “constant institutional exposure to the market”.
One of the key institutional requirements is participation (in markets). Retailers and investors expect to be fully deployed all the time. Because of the size of these positions, there simply aren’,t enough buyers (liquidity). It’s not major institutions can simply get on the “tele” and ask retailers to buy all the stocks they don’t want to continue holding /s. For the most part large positions must be hedged, not liquidated. That means spike in demand for puts when risk of market price decline is elevated. Because of full time participation AND that the vast majority of all positions are long (not short), VIX moving up almost always indicates concern of SPX drop. Put demand dominates call demand for index positions.
That doesn’t mean this assumption holds for other volatility indexes!
Fortunately there is a fairly simple way to tell whether the high or low volatility is attributable to demand for puts vs calls… the put/call ratio. (Weighted Implied Vol Premium of Puts / WIV Premium of Calls). A PC ratio > 1 suggests the put market dominates calls and vice versa. It is at the extremes of >2 and <.5 that are worth taking note of.
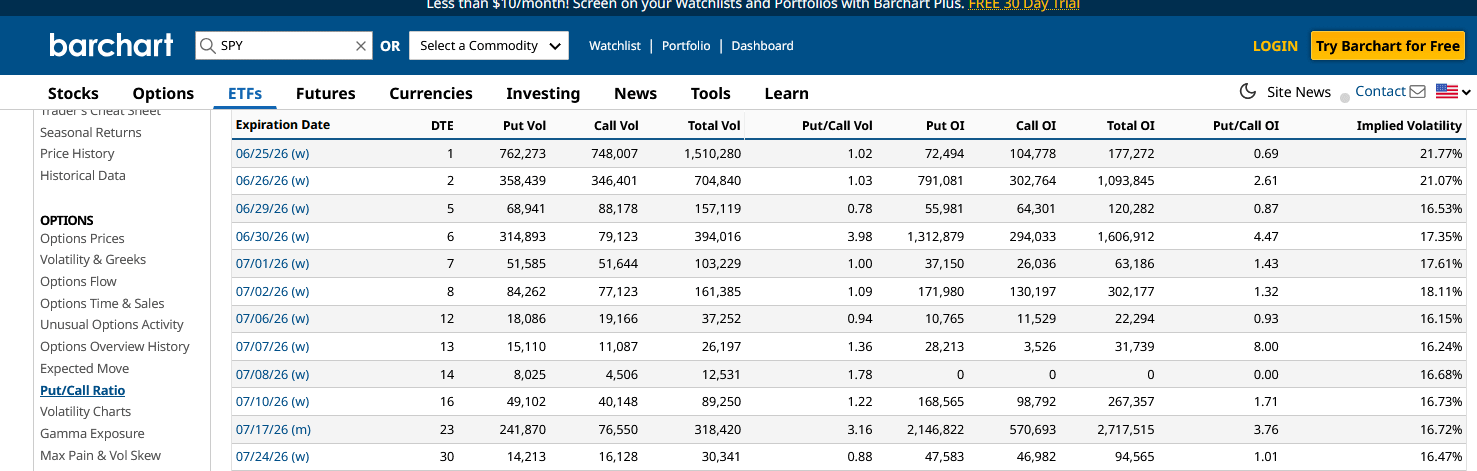
As of this writing, the market has printed several sharp down days, so as we would expect, the PC ratio is quite elevated well above 1 for most time frames.
Silver VIX
The following chart is $VXSLV, available on tradingview. Note that 2 year moving average has acted as support in bull and bear markets of recent history. Now that we have hit the 2 year MA, the volatility is looking to break up from its bull flag (not confirmed).
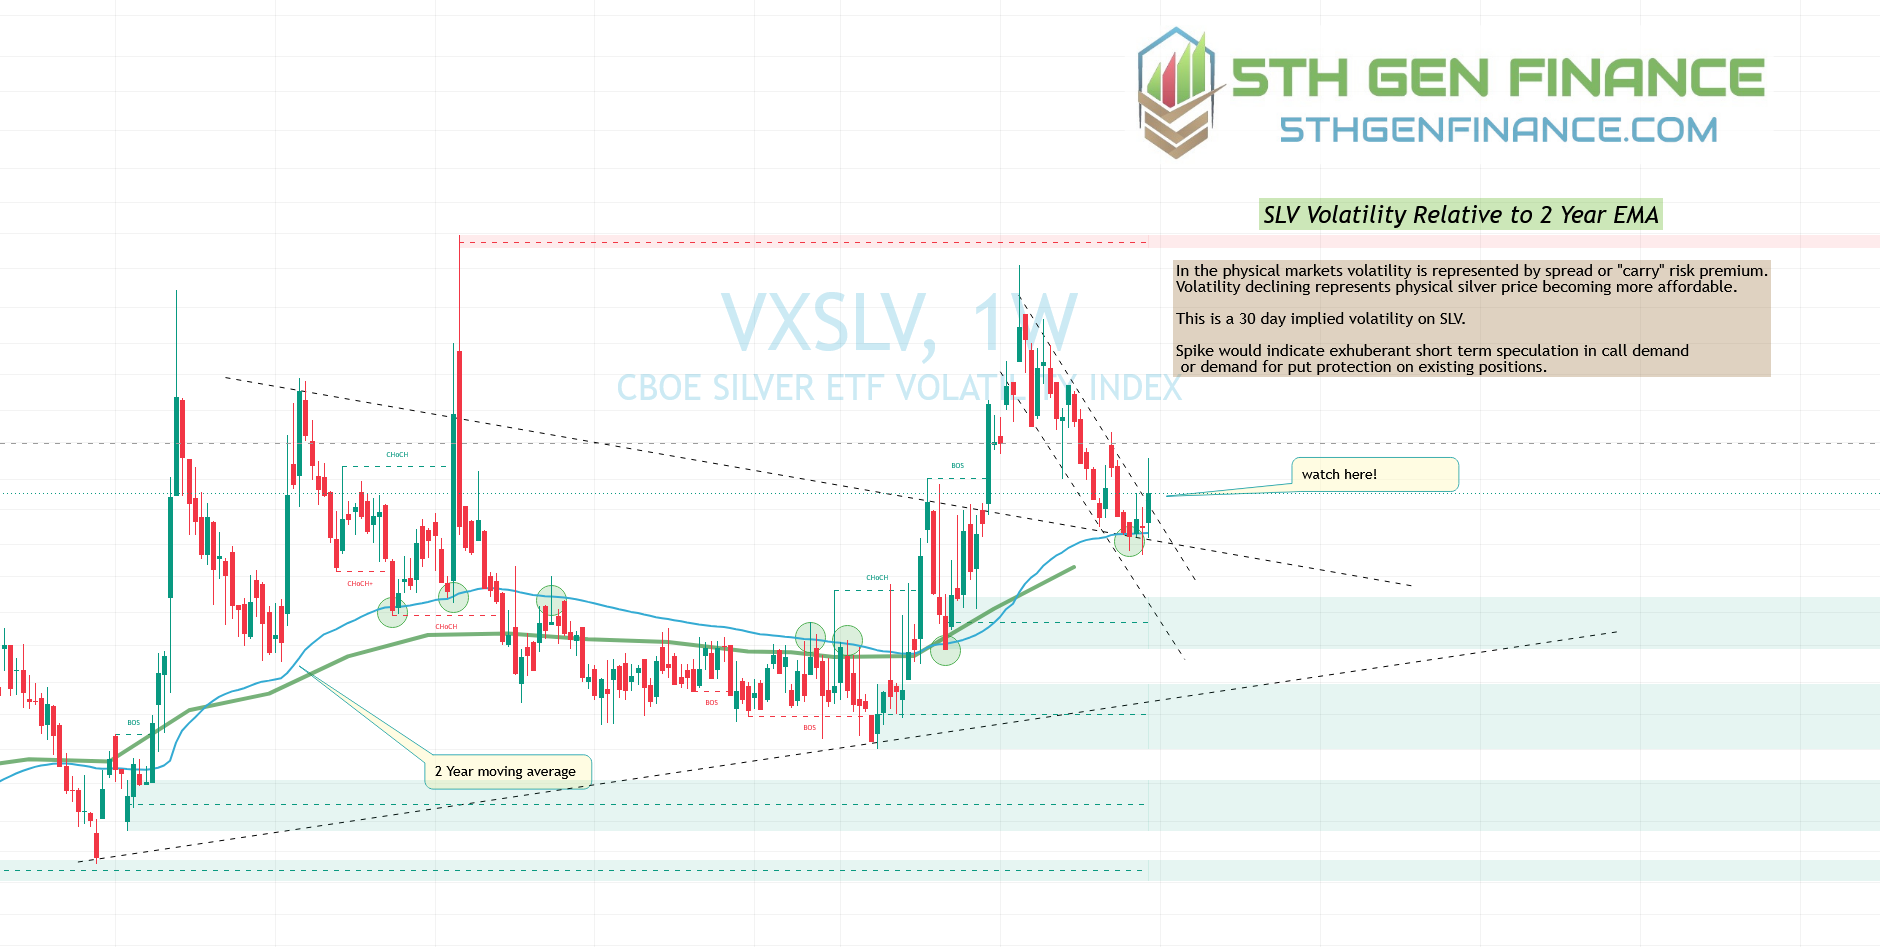
Does a projected increase in implied volatility suggest increase demand for Calls, Puts or both?
https://www.barchart.com/etfs-funds/quotes/SLV/put-call-ratios
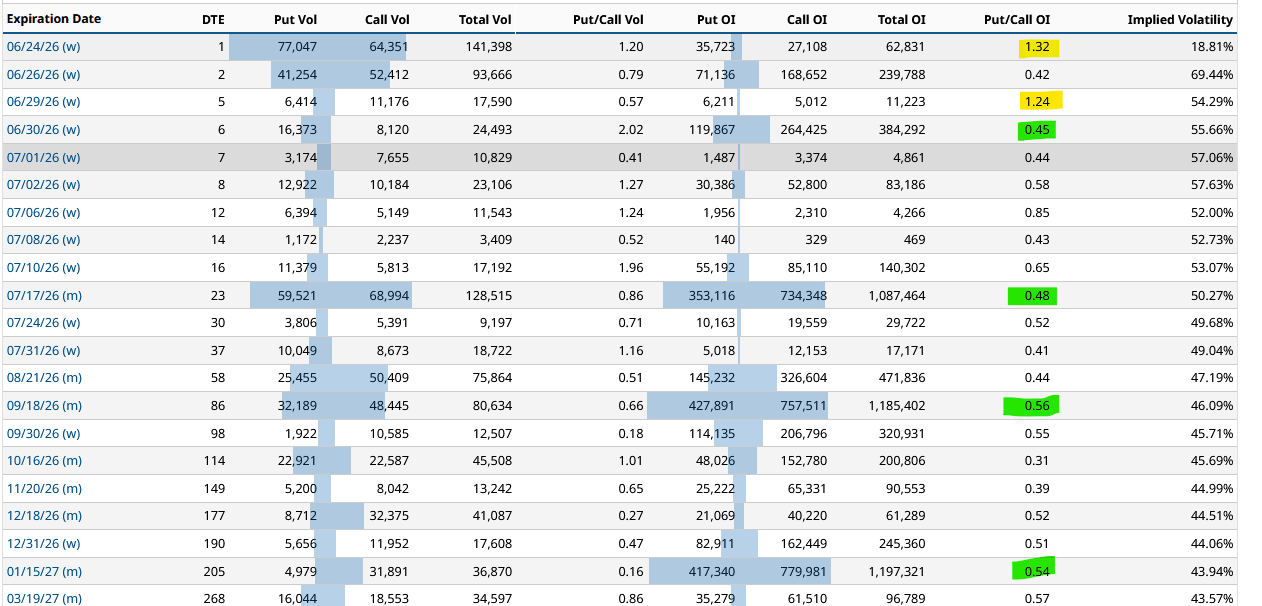
The answer is simple… calls. In contrast to S&P, silver’s option demand is heavily dominated by calls. Just as we would conclude ^VIX breakout is potentially bearish for the S&P, we can conclude VXSLV breakout to be explosively bullish for $SLV (Silver proxy).
As of this writing, today’s drop in silver was near 7%! Yet, all but extreme short term P/C ratios were well under 1. Pay close attention to the high open interest blocks (green). The implied vol to the upside is nearly twice that of that to the downside! Market participants are (willingly) spending a fortune to get a piece of the next breakout!
Add VXSLV to you charts and pay close attention. It may help forecast the next breakout move!
Note: we don’t have enough historic SLV 0.00%↑ data to accompany the previous bull markets of 2000s and 1970s to verify this predictive confluence.
The information provided is for educational and informational purposes only and should not be construed as investment advice. All investments carry risk, and past performance is not a guarantee of future results. Trading options involves a high degree of risk and is not suitable for all investors.