

Mecury Rising, Globalism Falling
What the next 6-8 months hold for our investing thesis.

Summary
As is the thesis of this stack, global war is nothing new to the decade. It is in our opinion that the latest global conflict is well into its 6th-8th year. In fact, the economic system of global capitalism has likely been in decline for more than a decade. These things have their expiration date. The latest news cycle around the Strait of Hormuz is only part of the story of this global information and trade network (markets are information systems). The efficiency on globalism has provided cheap imports, low rates, strong dollar and efficient, just-in-time delivery for our US markets. Expect this to deteriorate from here. Consider the following map as a simple illustration. How will the global natural resources move from where they are produced to where they are consumed? How will we know when those shifts are taking place? What are the impacts on commodities and transportation prices?
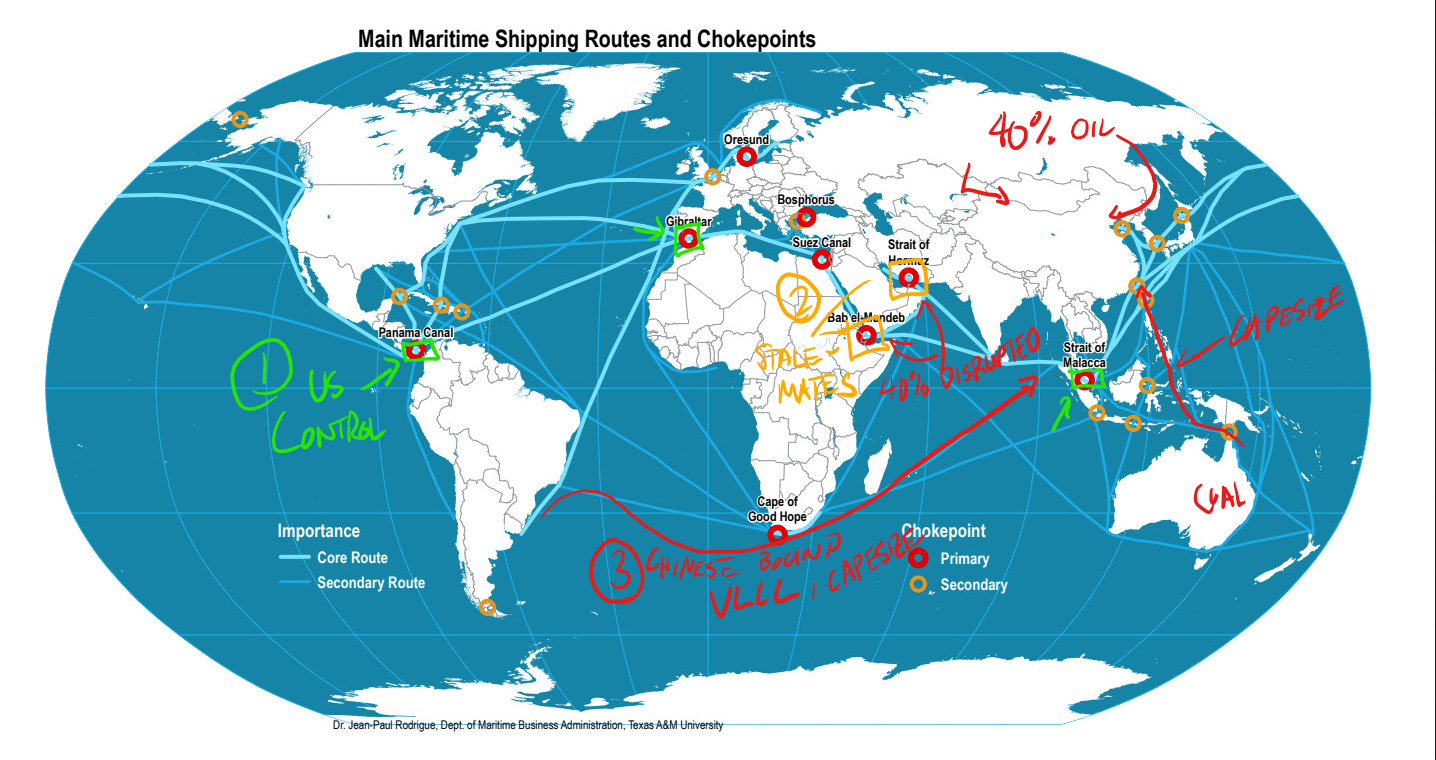
US is making a move or has already gained control of the Panama, Gibraltar and Malaccan choke points. They are likely to hassle the BRICS parties to some extent. This puts pressure on capesize and VLCC transport rates (bullish).
Bab el-Mandeb (Houti infamy) and Strait of Hormuz are at a transportation stalemate. These routes are currently uninsurable. This will require the insurance market to adjust to get things moving in the private sector.
Pressure is on Chinese energy imports. Of the 40% reliance on middle east, can it be made up in Russia or Brazil? Will some ME exports move? More pressure on VLCC (bullish). Some of the energy import deficits will need to be made up in the form of Australian thermal coal.
**Capesize refers to the largest dry bulk class of ship, VLCC (Very Large Crude Carrier) refers to the largest crude tanker. These ships are too large for the two major canal passages.
The consequences of current global conflicts are in no way limited to Ukraine and the Middle East. This represents a shift in what we can expect in terms of prices and availability of goods. Enter our commodity bull market. Raging…
The following represents our 3-12 month forward expectations of the various sectors we invest in. This is not investment advice. Do your own DD.
Precious Metals
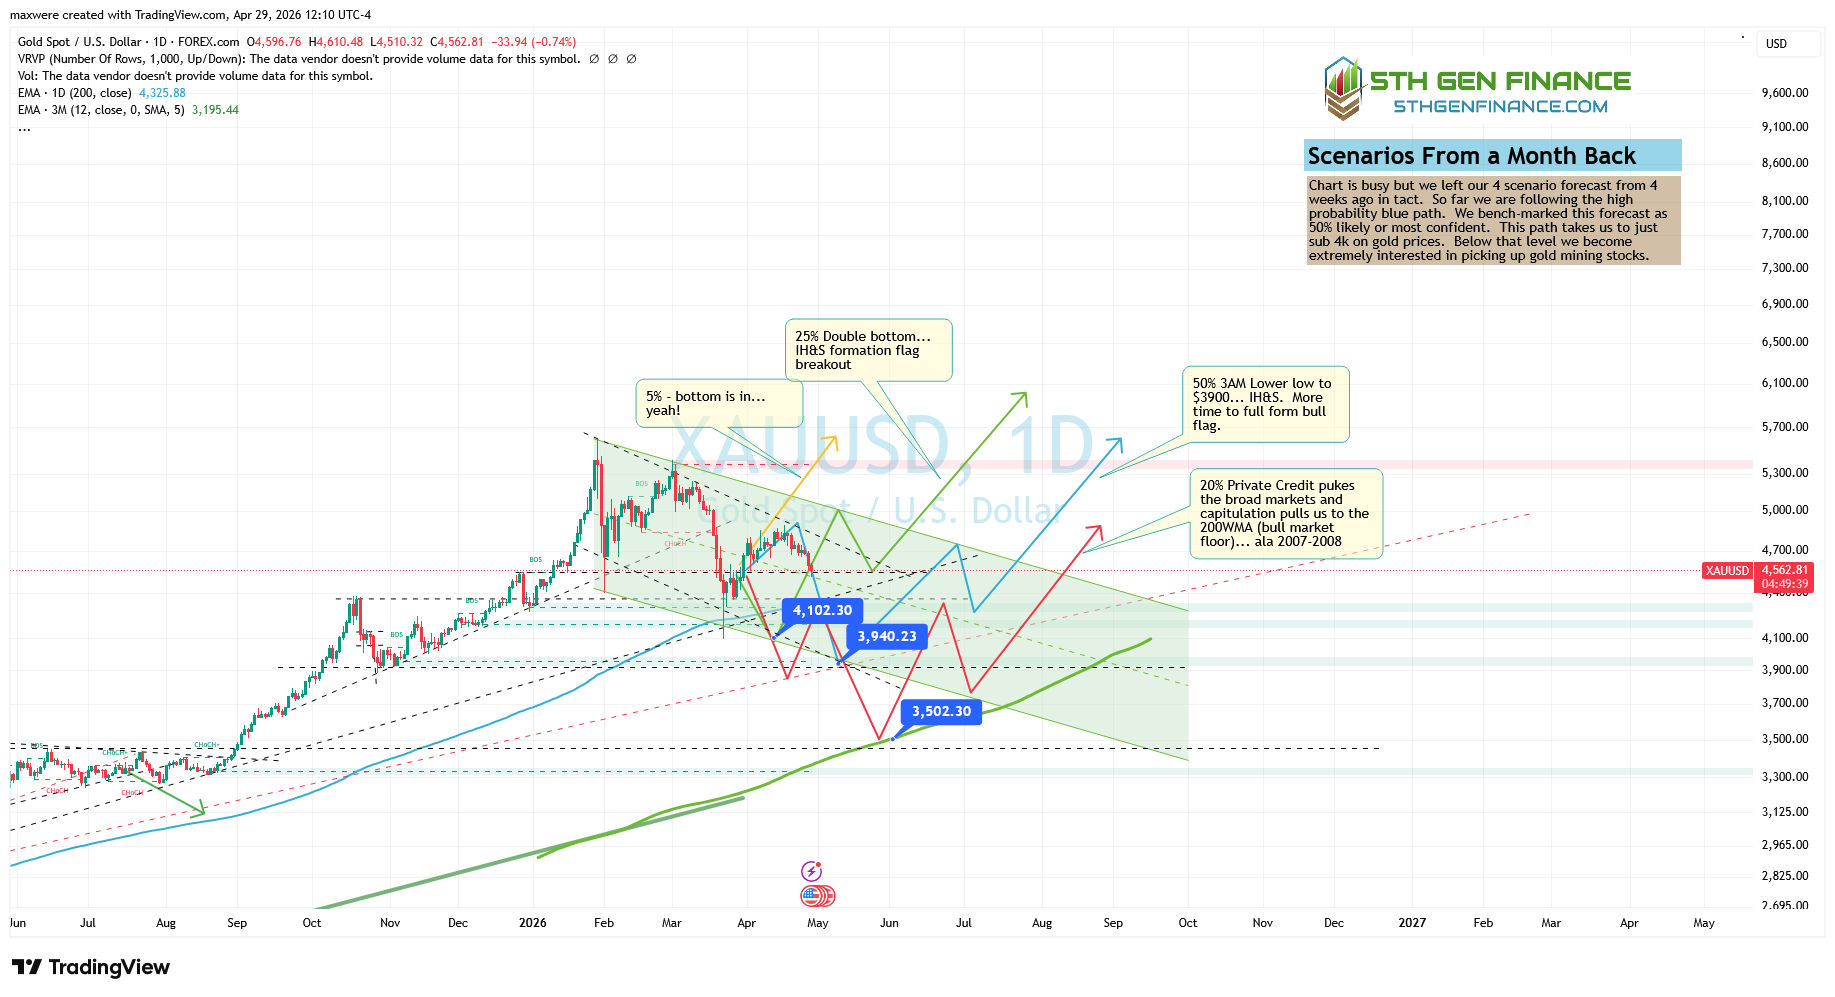
Look for a bottom as early as mid may. (fig1)
High quality mining stocks should be bought on 200dma if you can get them (if not, then near short term bottom levels)
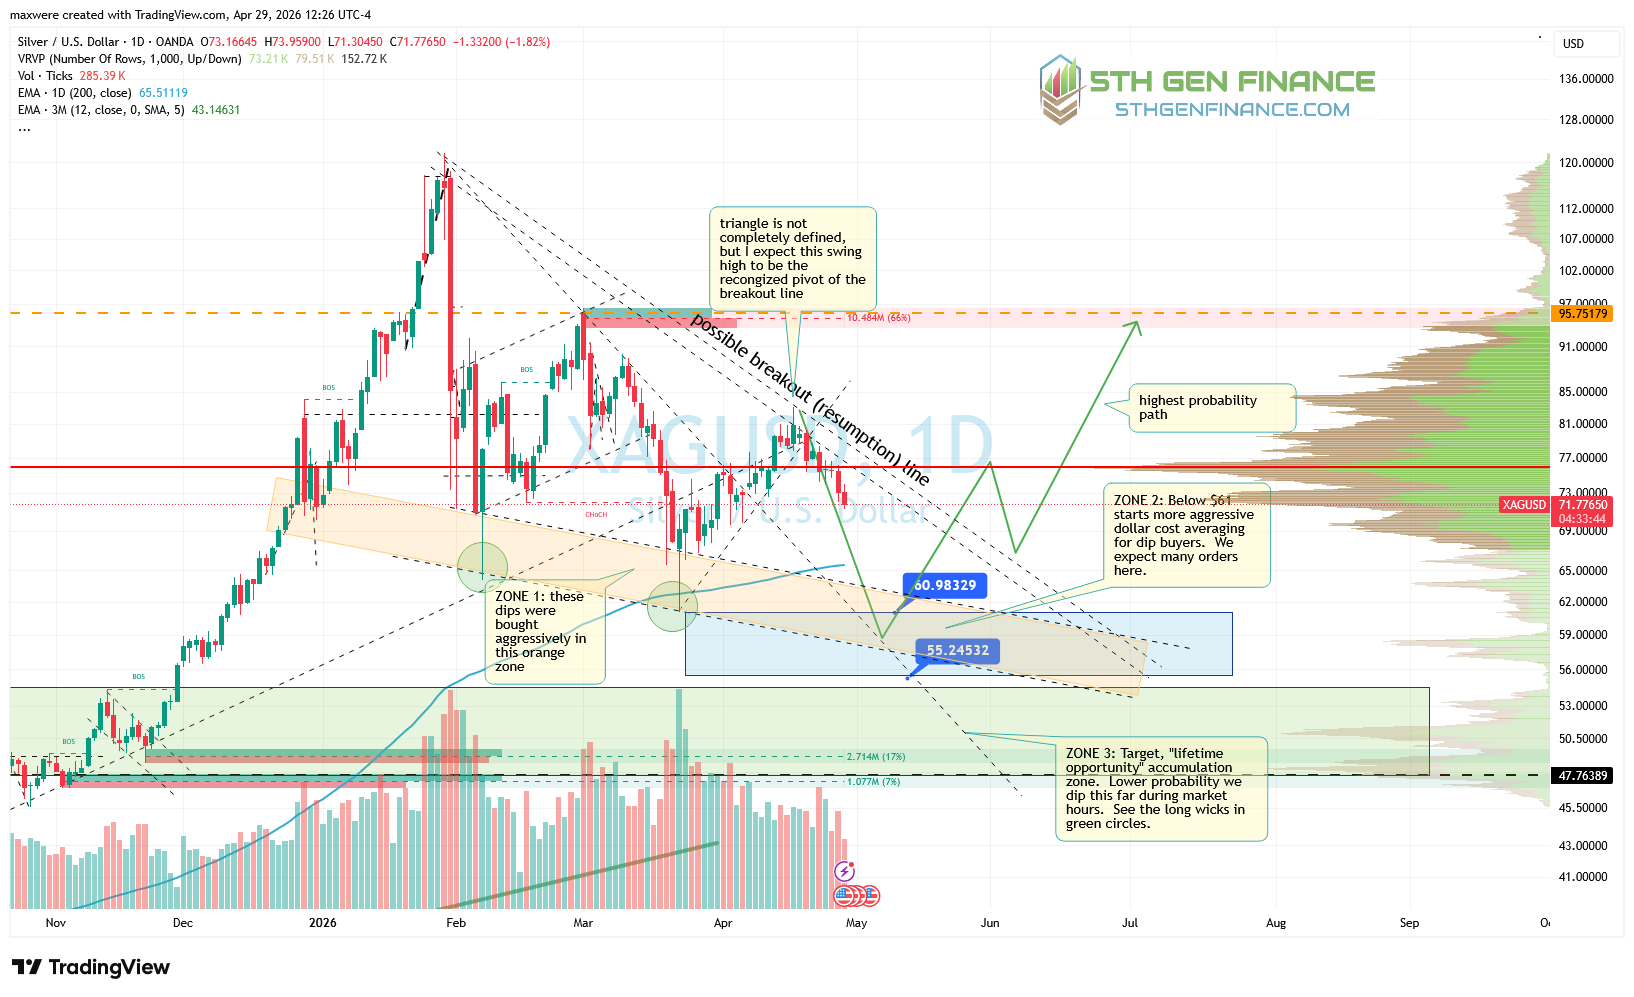
If these don’t suffice buy the breakout of the short-term triangle structure in the metals.
PM Summary
This was always going to be a break for precious metals following a historic run. We have a few time benchmarks to measure with. First, while the breakout of war and political disruption would logically signal demand for gold, this is typically seen on a lag of 3 months or so. This puts the breakout to late May. Second, January’s volatility takes time to burn off (especially silver). Extended targets suggested $90 was extremely optimistic and the market eviscerated those levels. Enter bull market consolidation periods. These are usually a period of 3-4 months. This brings us to May. The entry prices we’ve been waiting for are right around the corner.
PM Charts
Gold Short Term
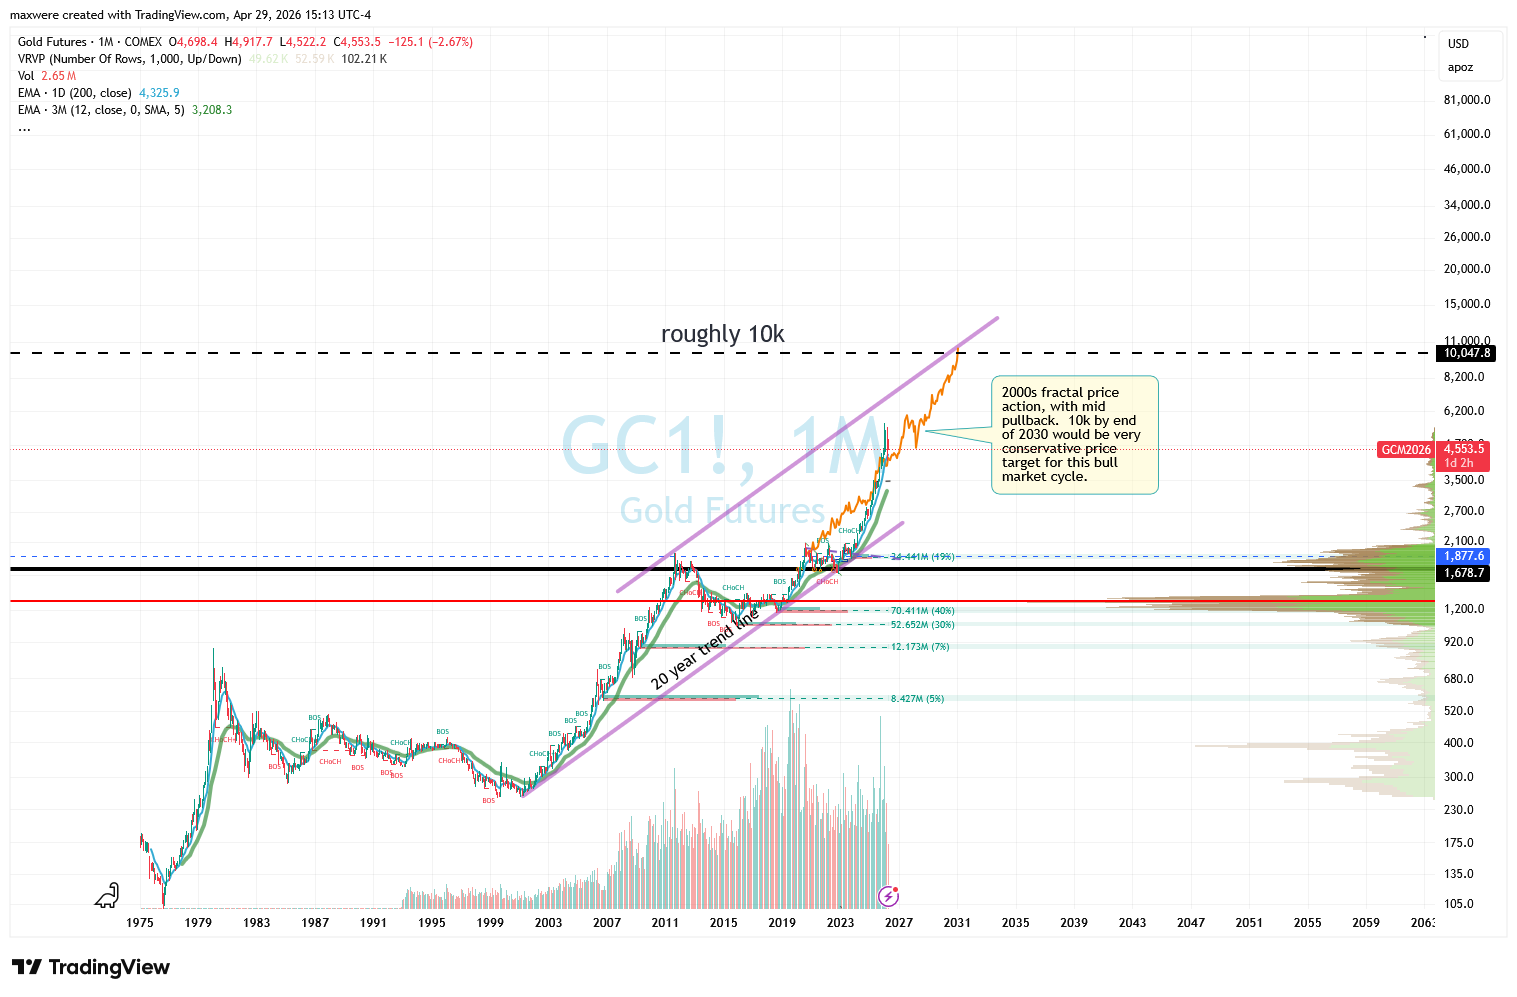
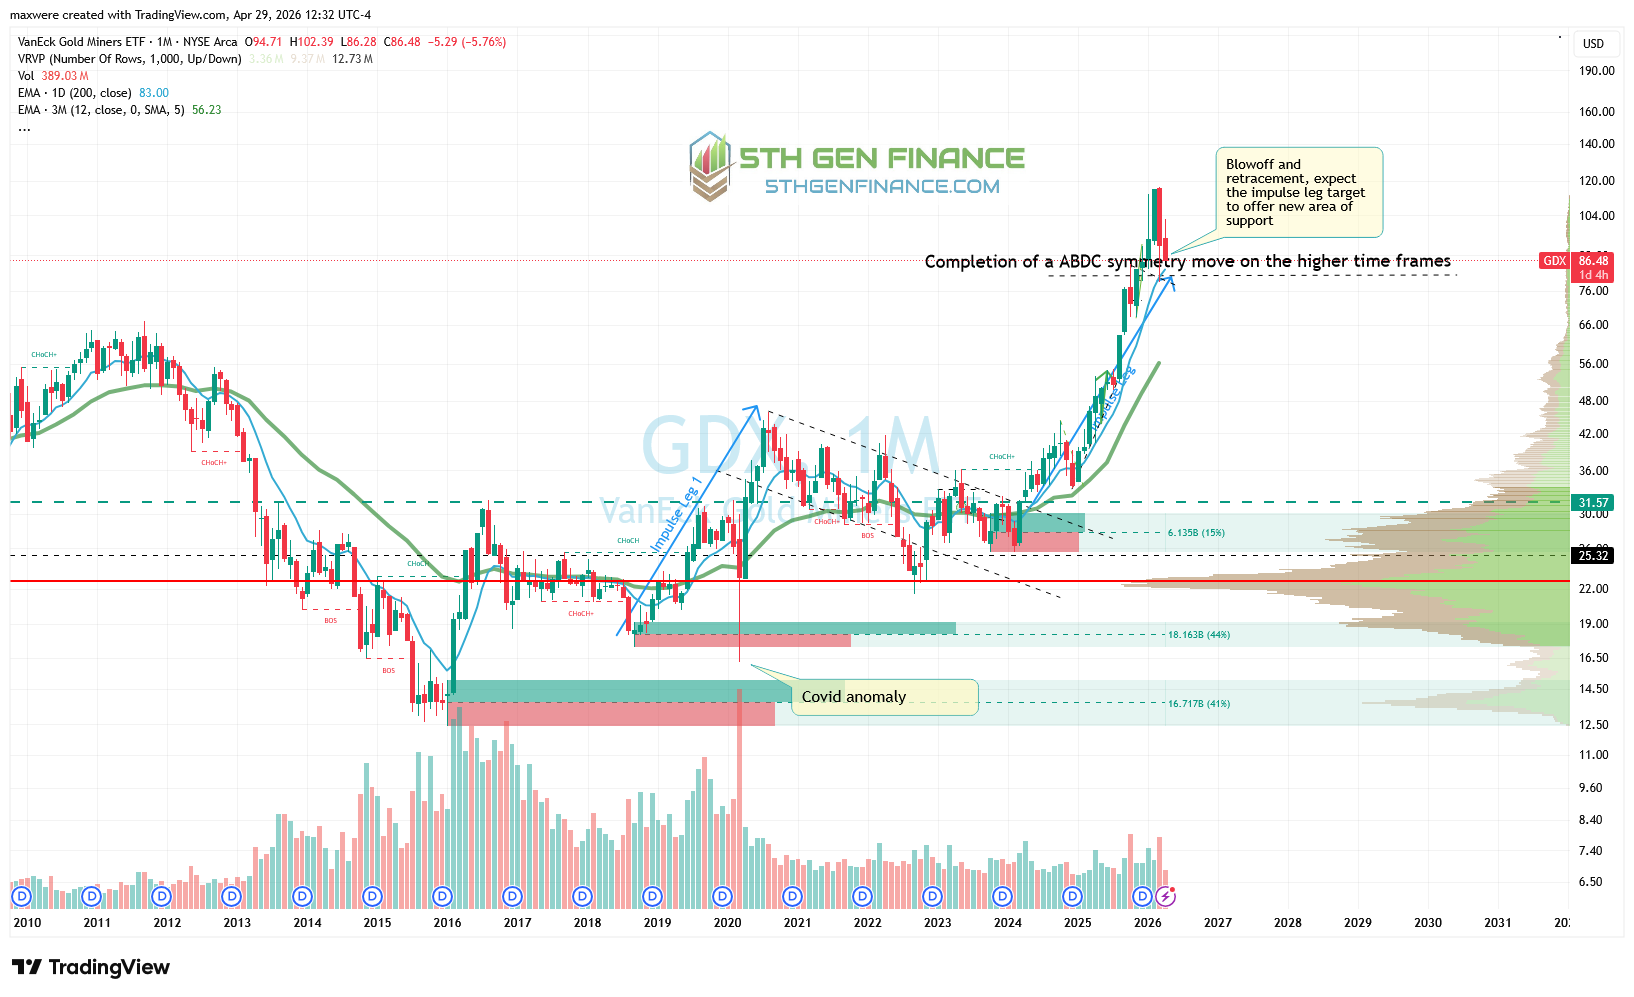
Gold Long Term
Silver Short Term
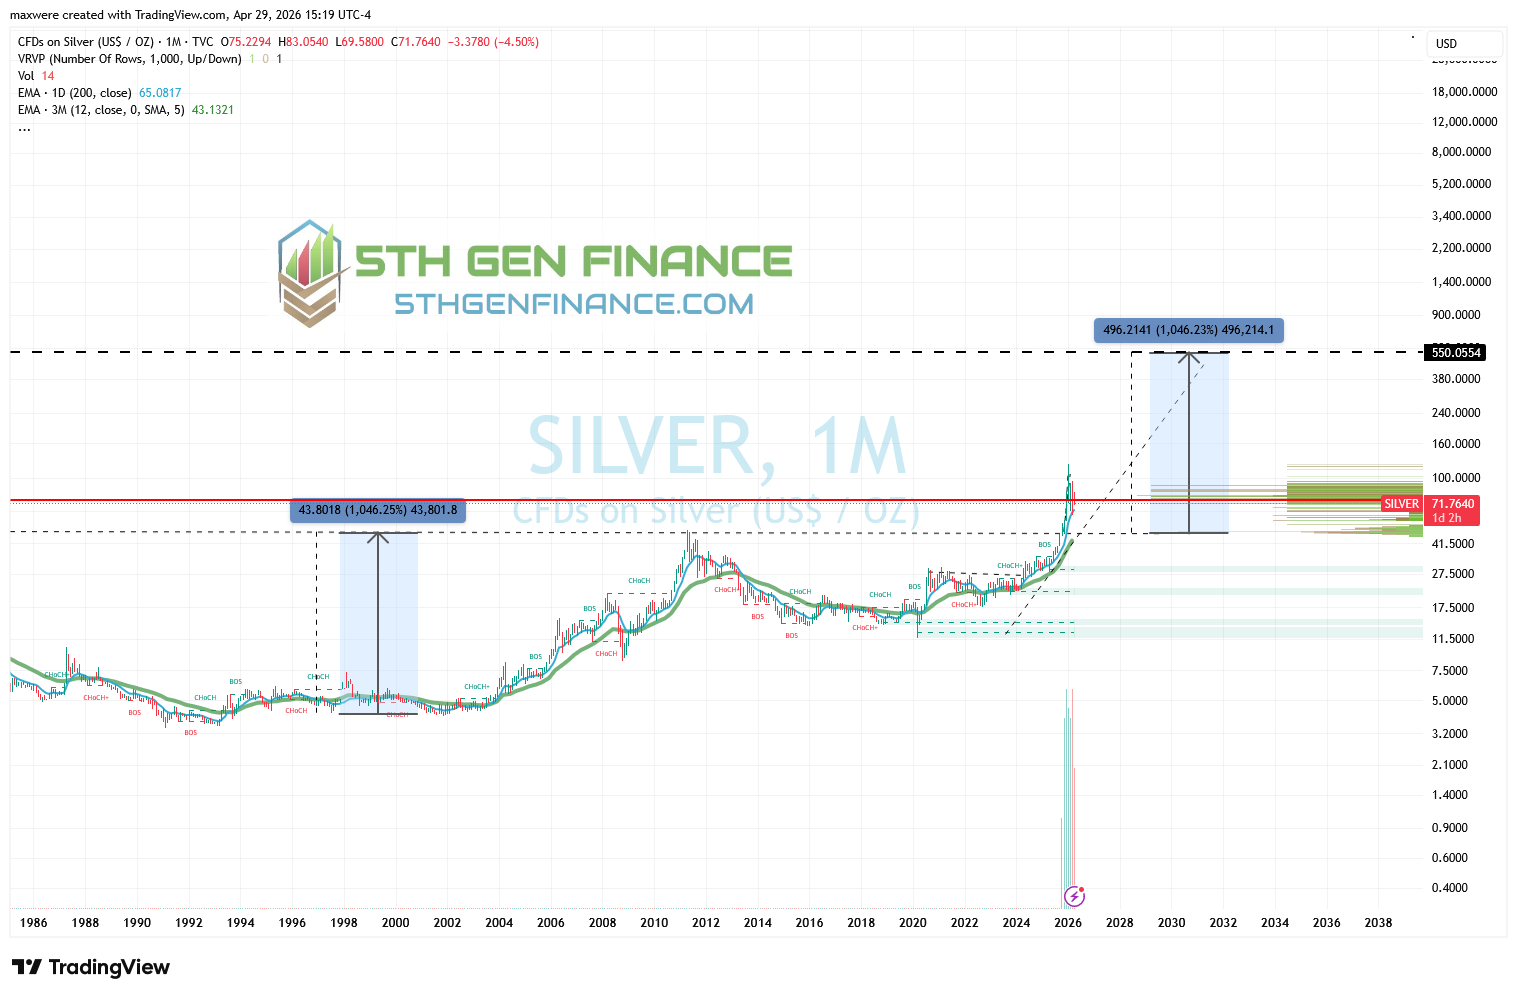
Silver Long Term
Most readers are likely aware of “the largest cup and handle in capital markets history”. This pattern projects $550/oz price target for silver. That seems outlandish, by even the most “fiat” among us. None-the-less, you will likely hear much higher targets in the coming years. BOA has projected as high as $300 for the year (don’t trust them it’s just gold to silver ratio supported): https://www.msn.com/en-us/news/insight/bank-of-america-projects-silver-could-hit-309-by-2026/gm-GM69F78440
Mining Stocks
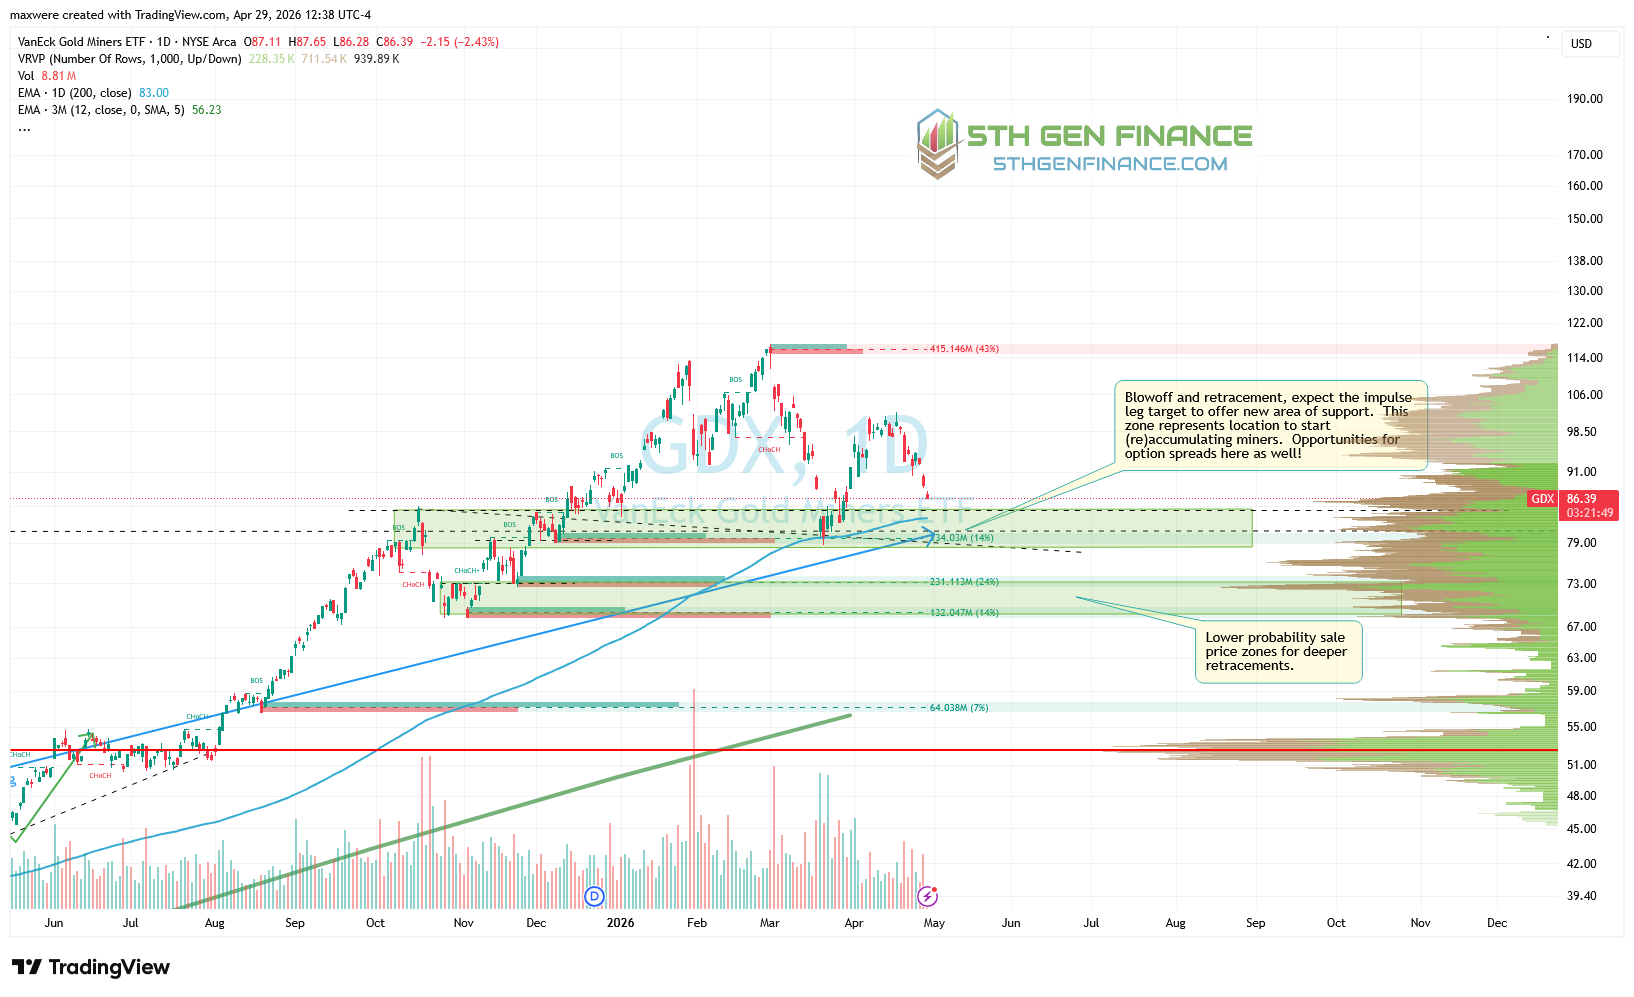
Use the major indexes and ETFs to set manage your tradingview alerts. This can be helpful if you have alert limits.
Conventional Energy (Oil, Gas and Coal)
Energy Summary
The latest Iran conflict exposes the US inability to provide necessary protection for OPEC states. While BRICS nations have been exchanging oil in currencies other than dollars, this marks a major milestone in the end of the petrodollar.
breaking UAE leaves OPEC - OPEC was the creation of the petrodollar era. This is the latest sign of the end of the petrodollar. The forward gulf bases future is in doubt. You can expect western spin, but this is the old-world hegemonic power deconstructing as part of a hegemonic reset.
Domestic oil and gas was breaking out before the Iran war did (fig5). We read this as long term move for higher prices, inflation and back-filling of data center (unplanned) energy demand.
Short Term Price Crude
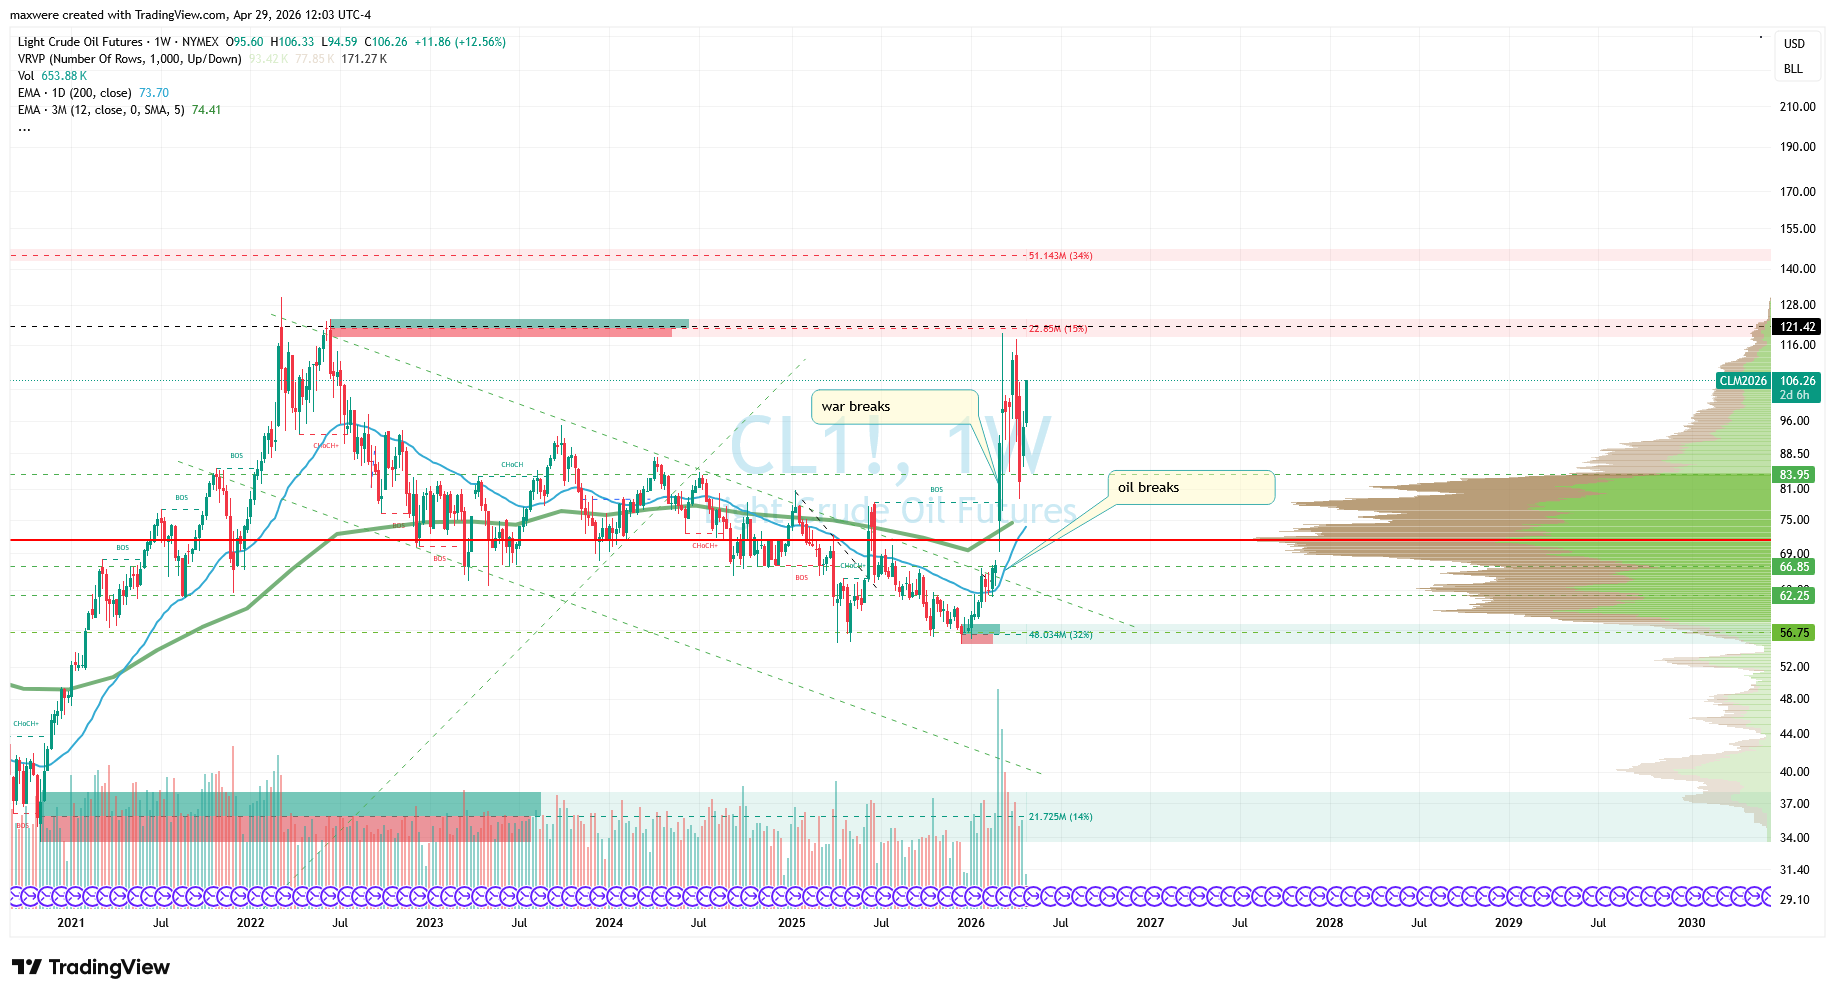
Long Term Price Crude
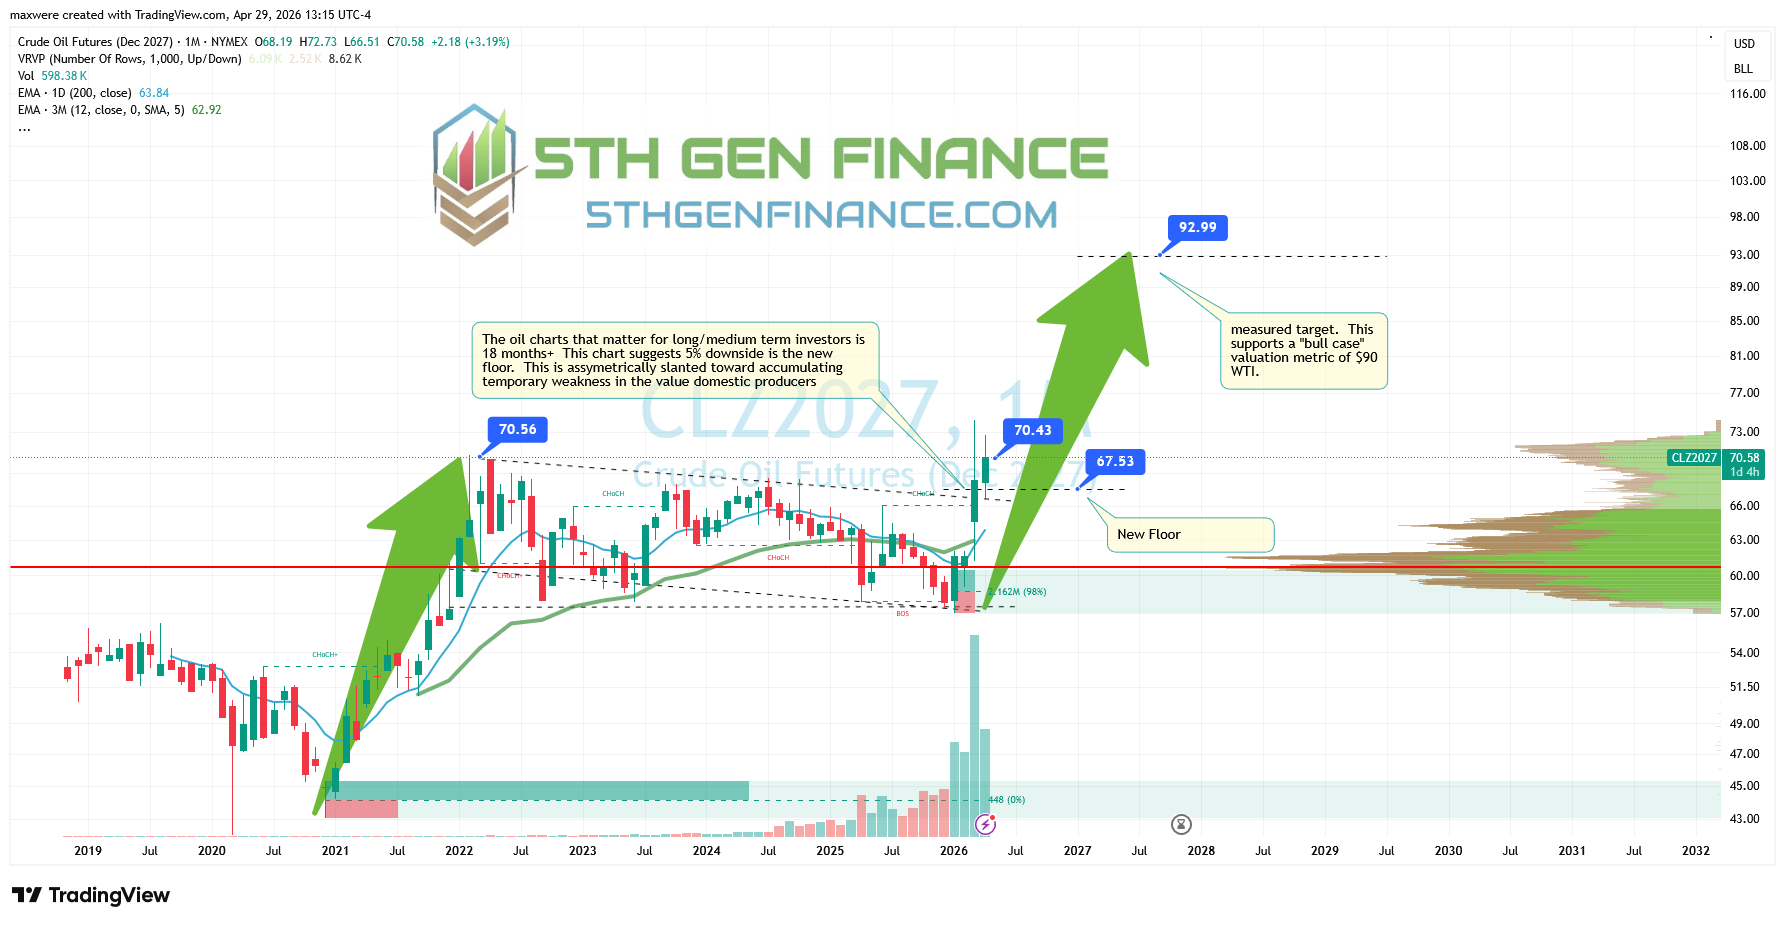
While oil and gasoline prices may temporarily spike much higher, our bull case valuation numbers won’t be higher than $90 per barrel for the purpose of NAV forecasts. Term delivery prices are much more indicative of producer prices in terms of relative movement.
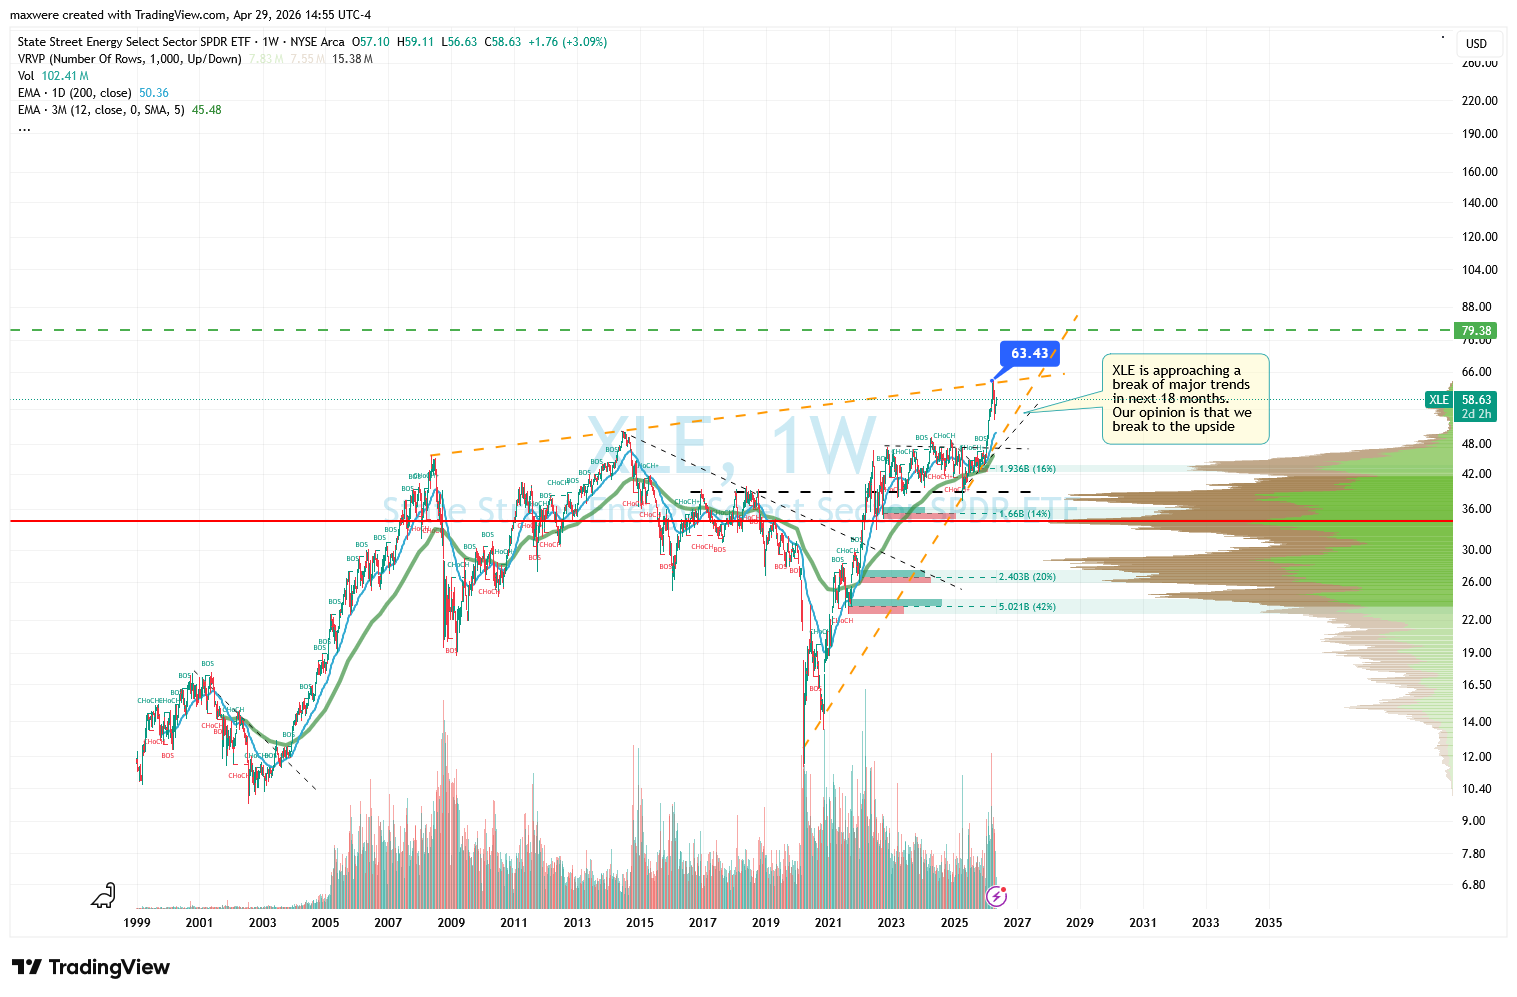
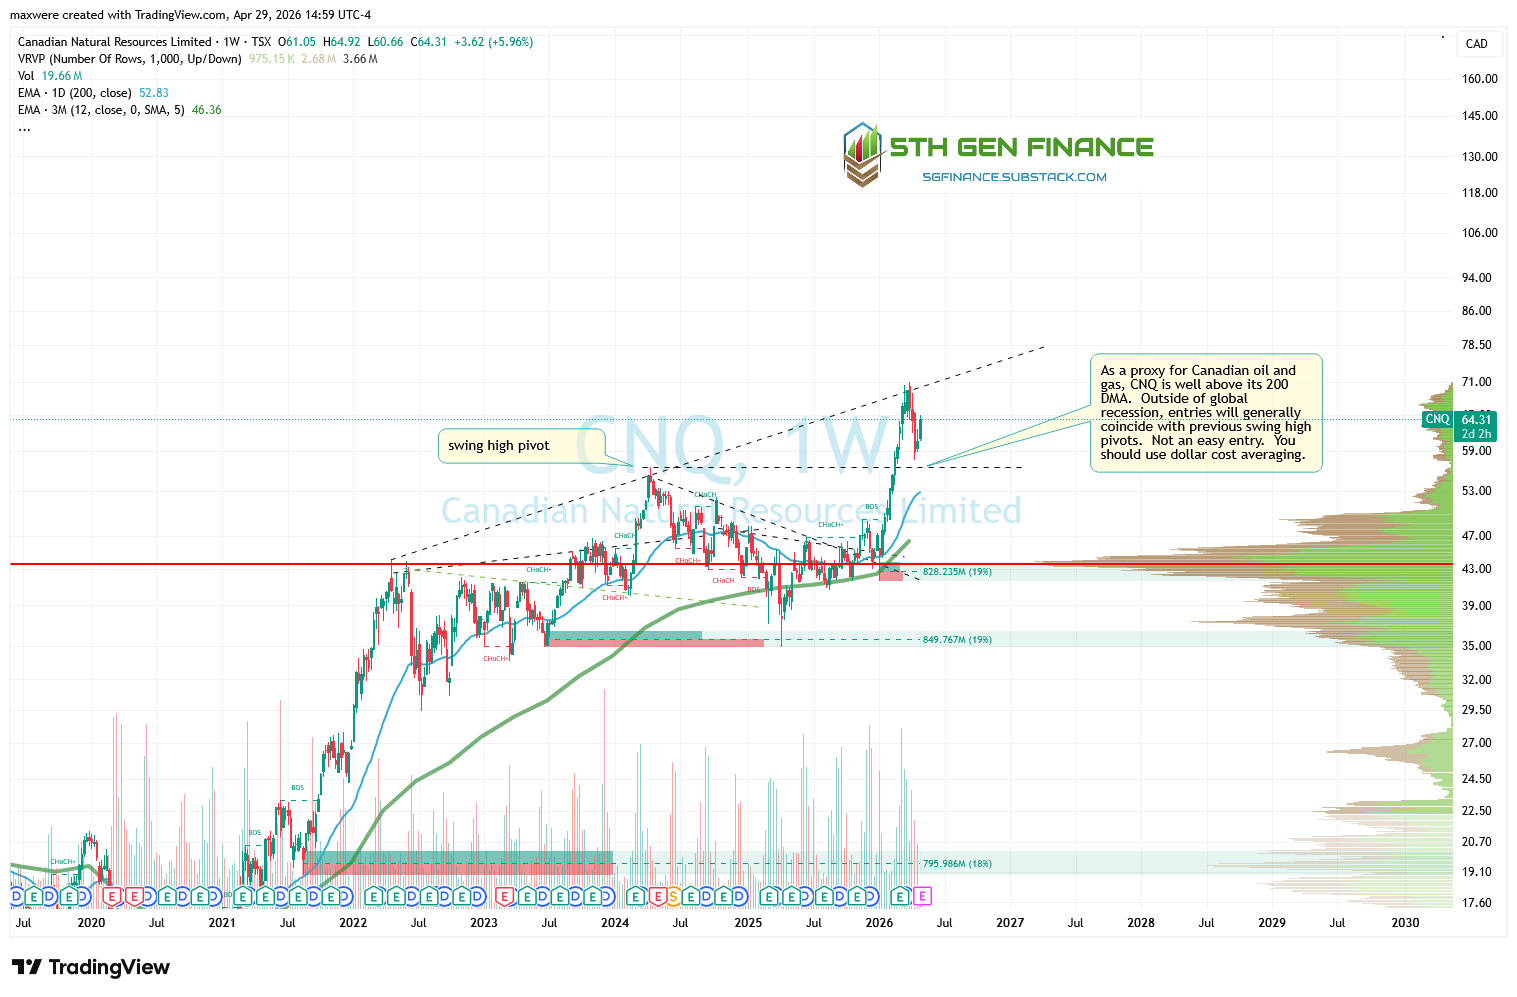
Energy Stocks
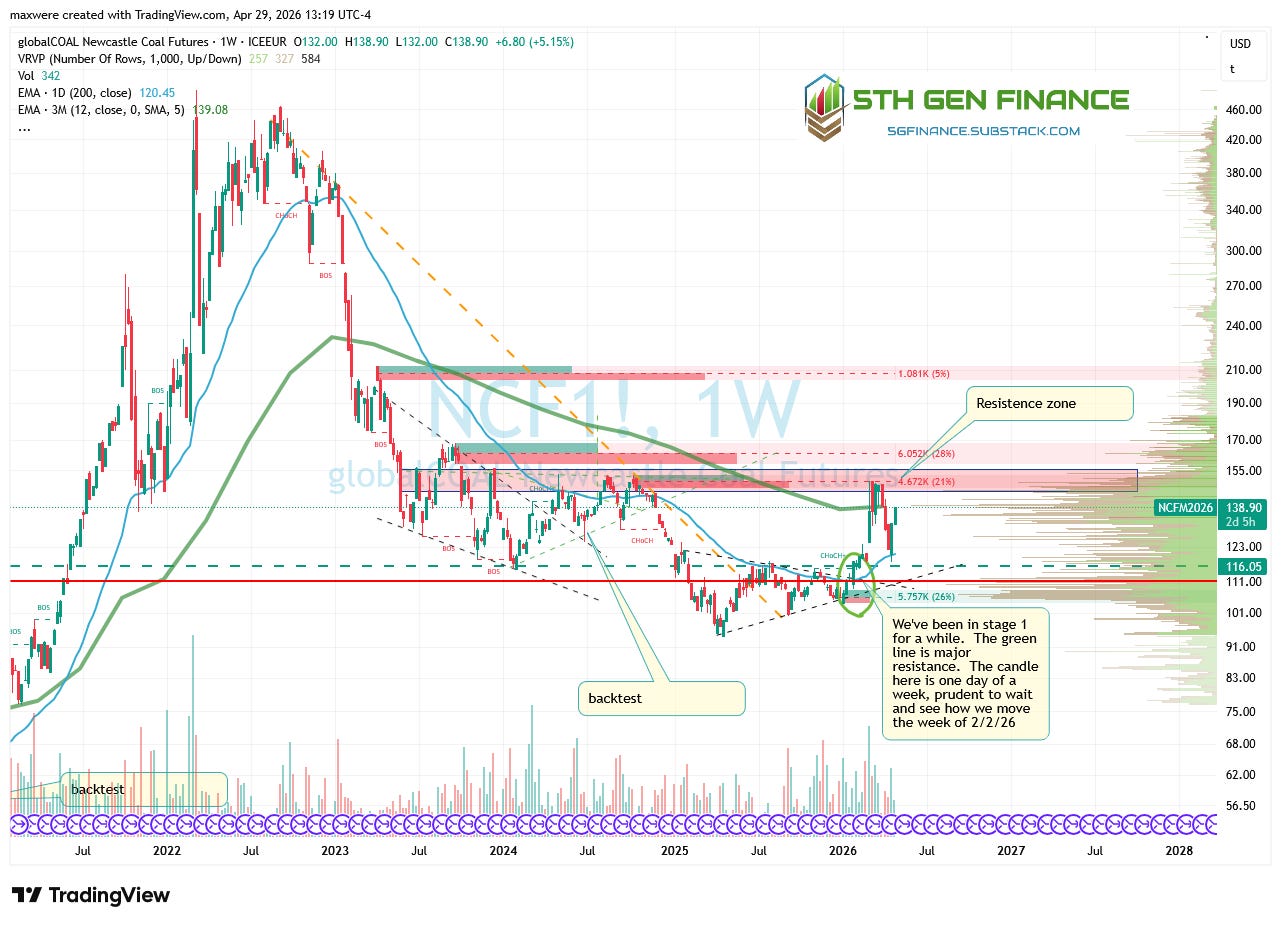
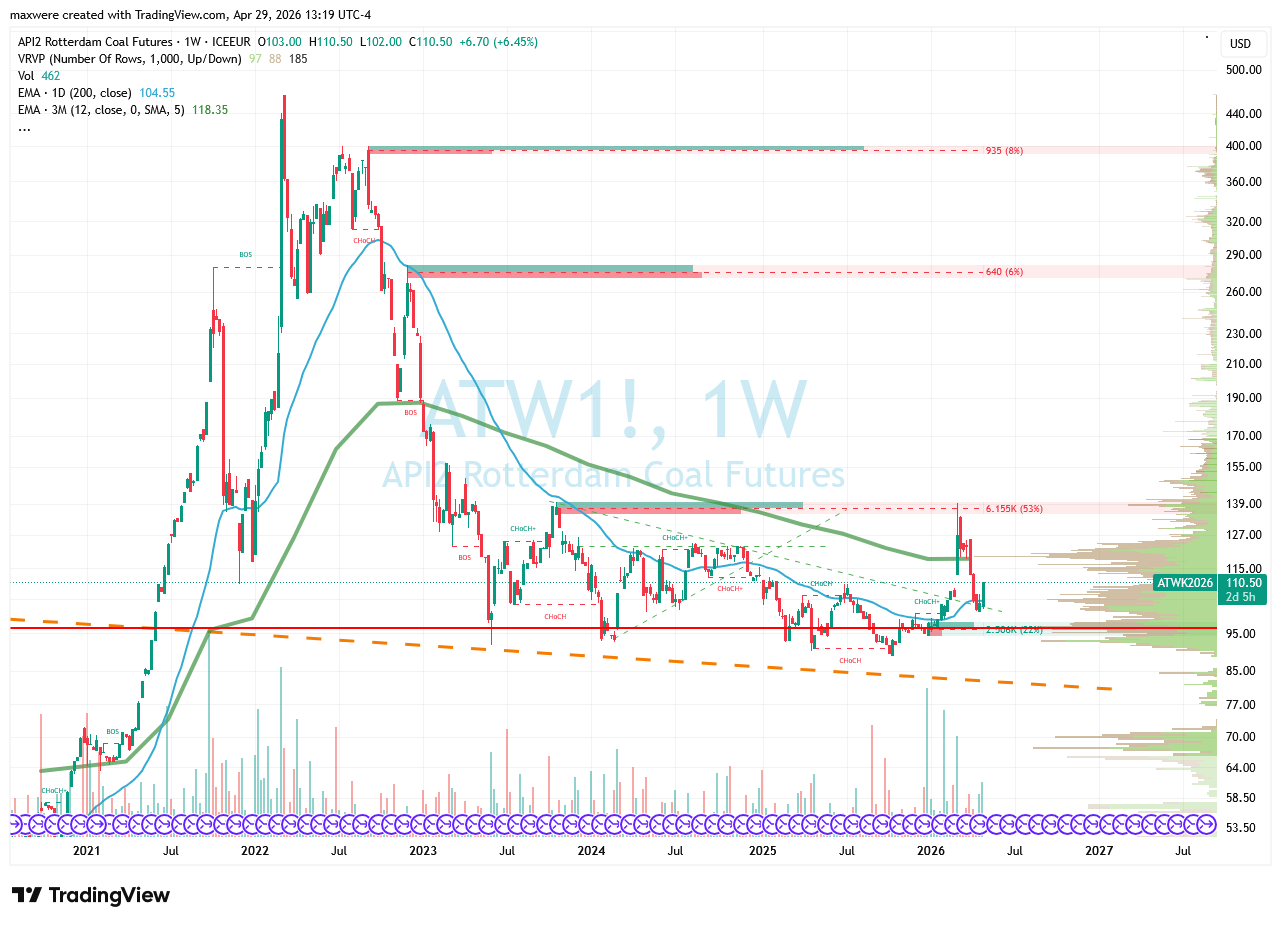
Thermal Coal
After a bearish few weeks, we are getting a bounce off of the 200 day MA. This price action is heavily covered in Stan Weinstein. This looks to be the very early stages of a cyclical bull in COAL. A break of the $150 level on New Castle could be quite impressive. This is still several months away at minimum.
Coal Stocks
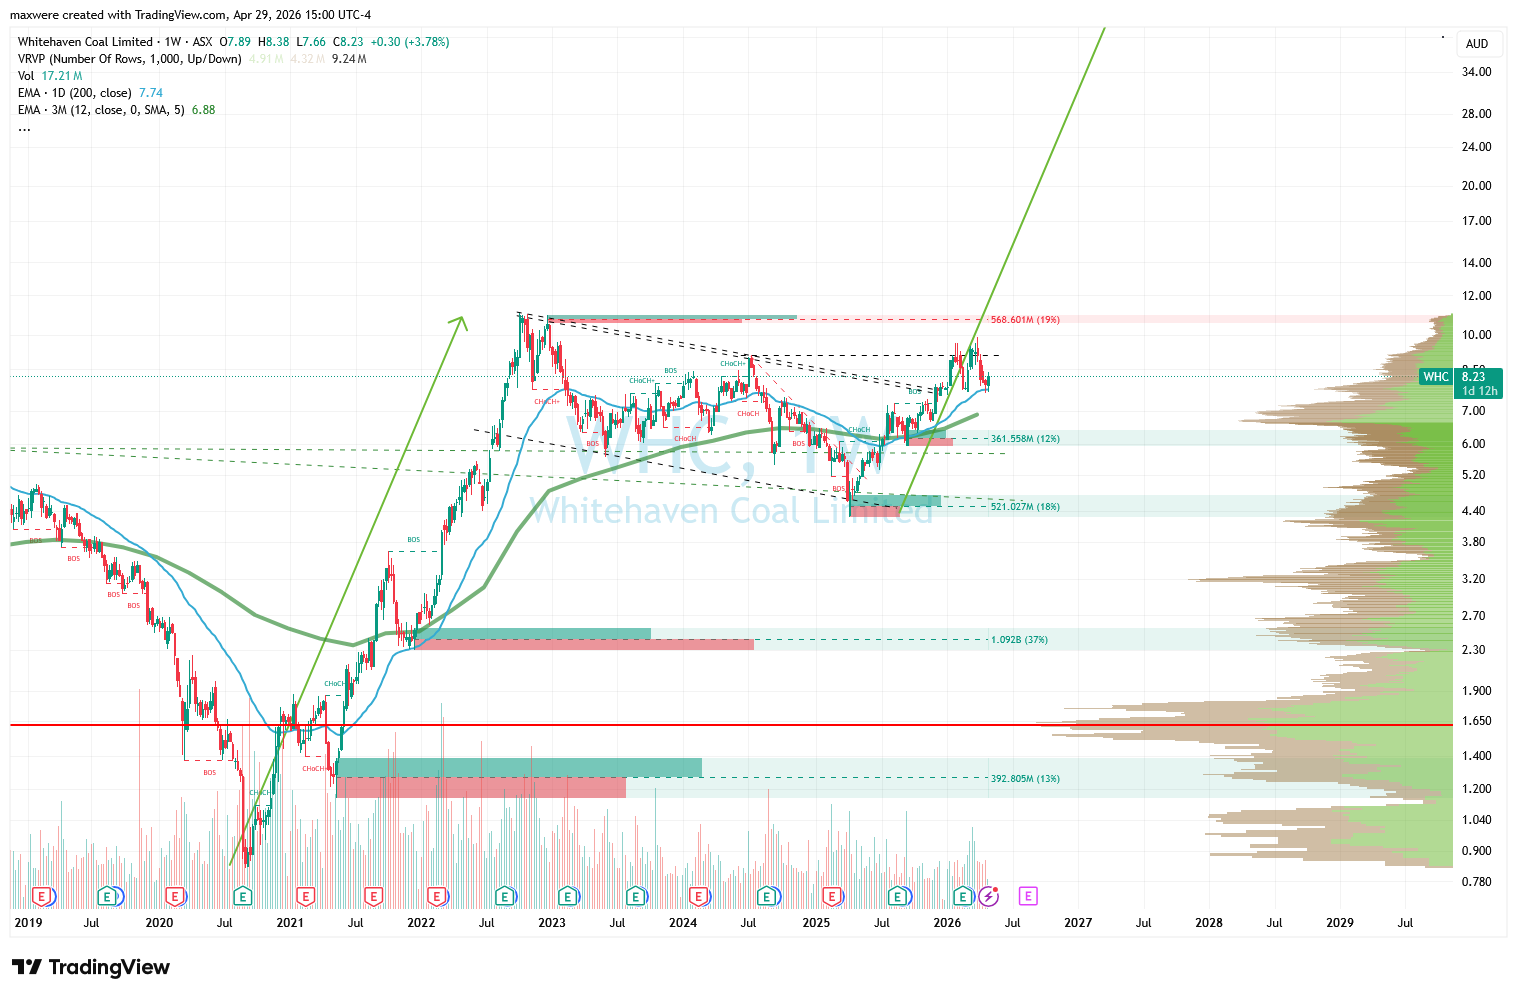
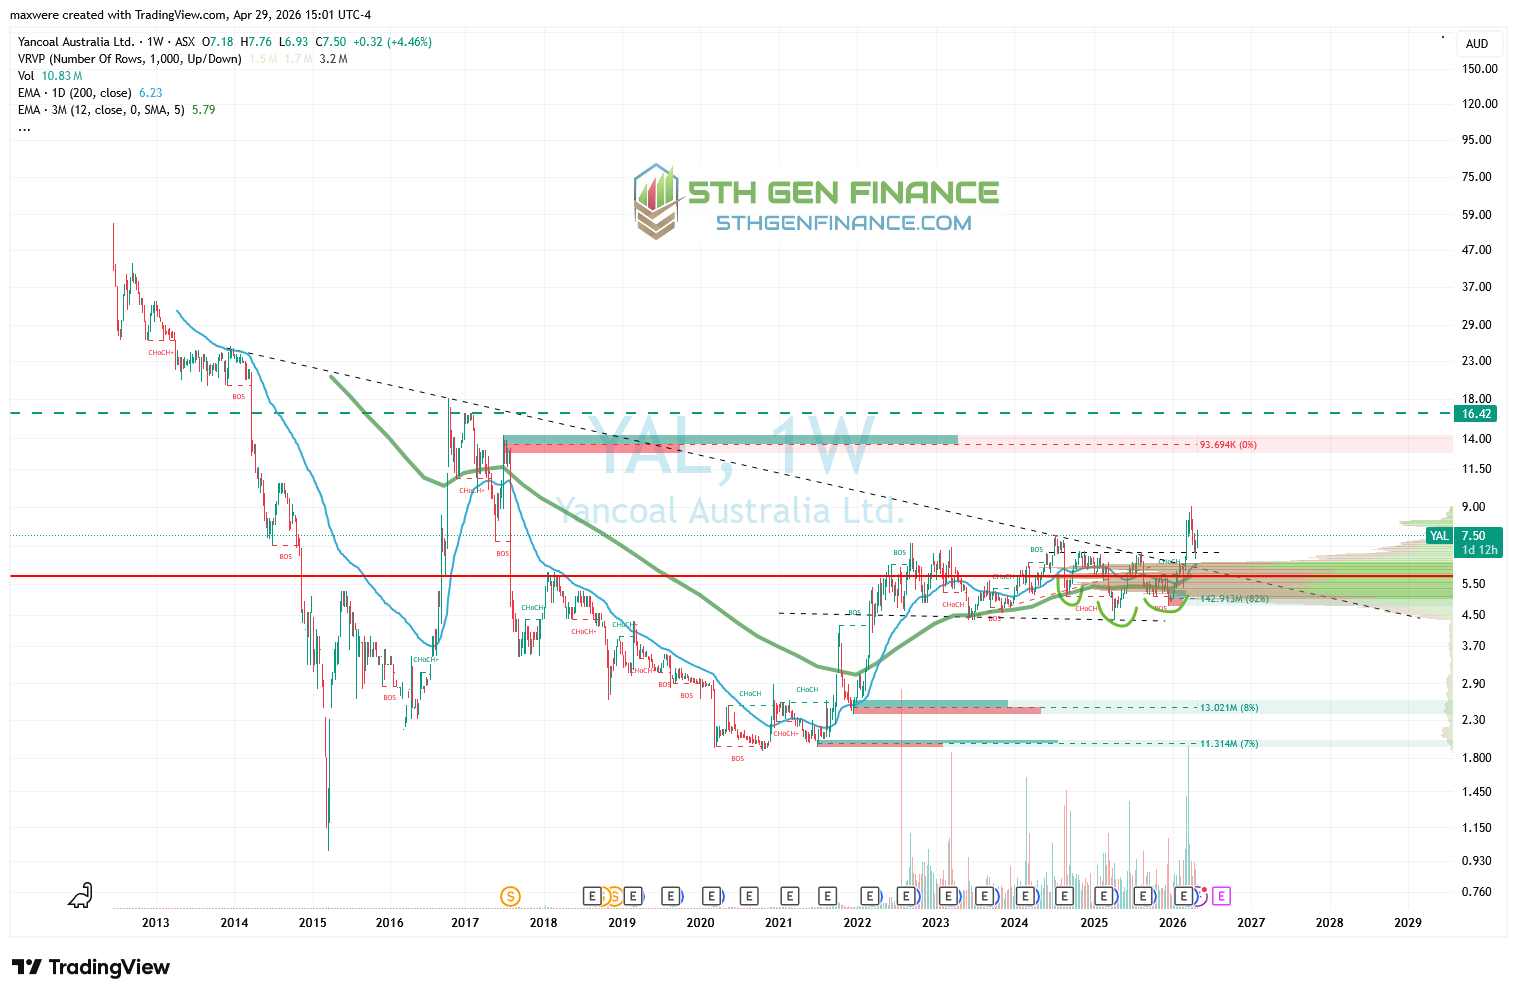
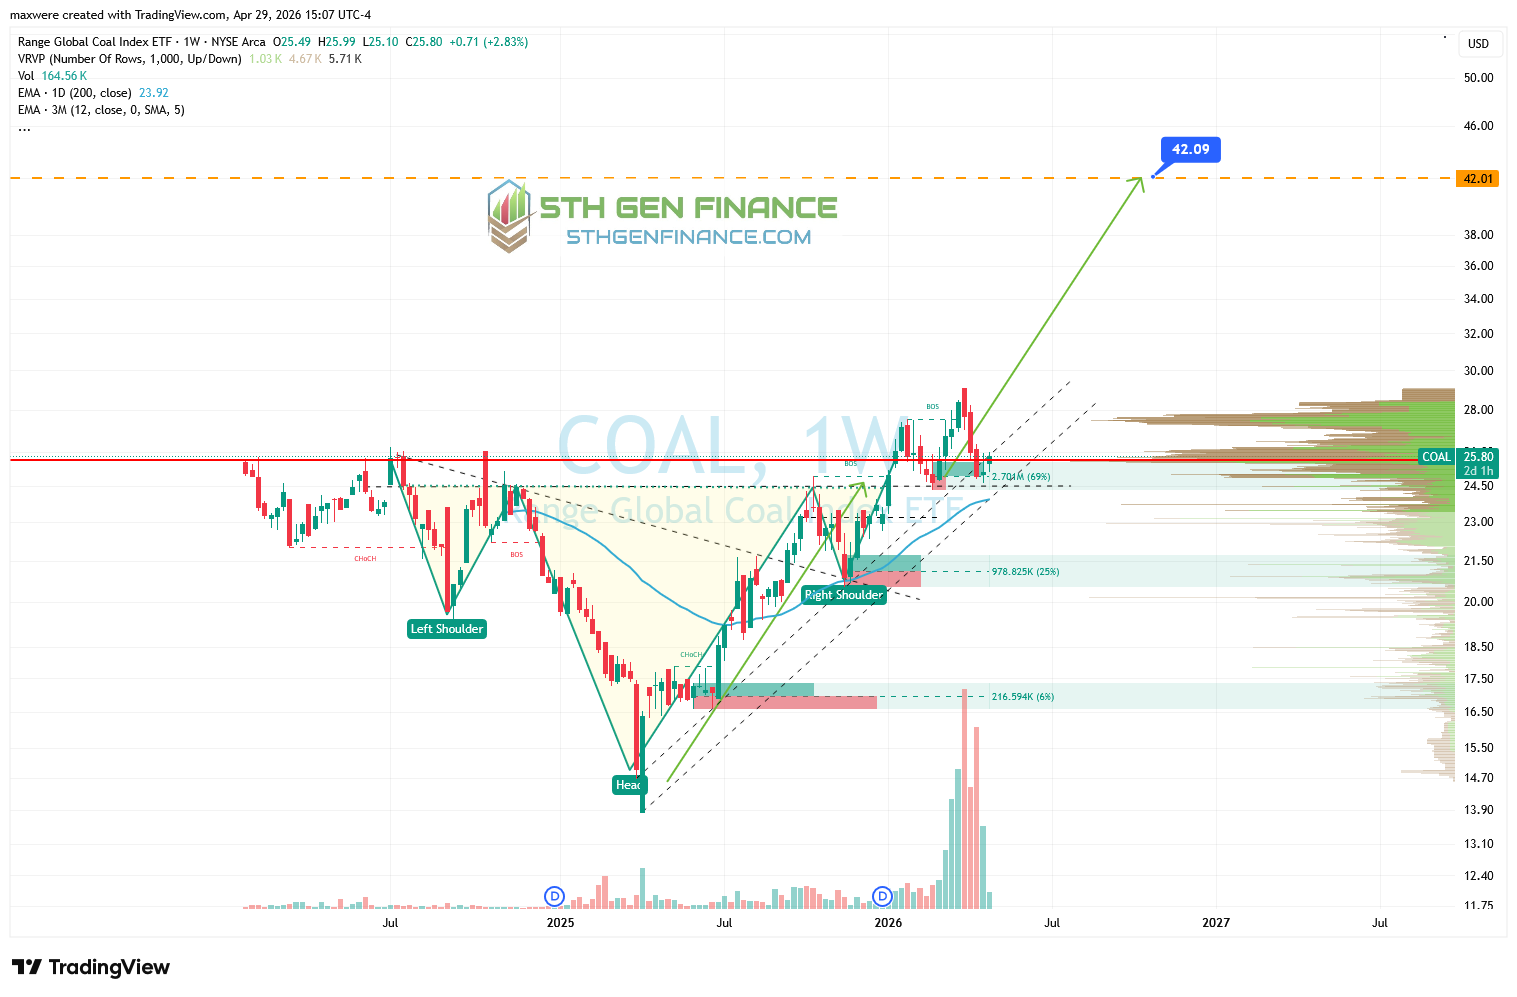
For most investors the COAL etf will be the play for a reasonable allocation. As with oil, the trend is our friend in bull markets. Add positions confidently on dips.
The information provided is for educational and informational purposes only and should not be construed as investment advice. All investments carry risk, and past performance is not a guarantee of future results. Trading options involves a high degree of risk and is not suitable for all investors.